VWCE and VWRL are not two different ETFs. They are two share classes of the same Vanguard fund, the Vanguard FTSE All-World UCITS ETF, which tracks the FTSE All-World Index and holds exactly the same portfolio in both classes.
In a nutshell, the key difference between VWCE and VWRL is what happens to the dividends. VWCE is the accumulating share class (ISIN IE00BK5BQT80): the dividends paid by the companies in the index stay inside the fund and are reinvested. VWRL is the distributing share class (ISIN IE00B3RBWM25): those dividends are paid out to you four times a year.
Note: VWCE, VWRA and VWRP are the same ETF, with the same ISIN and the same portfolio. VWCE is the EUR listing (Euronext Amsterdam, Deutsche Börse and Borsa Italiana), VWRA is the USD listing (London Stock Exchange and SIX Swiss Exchange) and VWRP is the GBP listing on the London Stock Exchange. The same happens on the distributing side, where the same share class trades as VWRL, VWRD and VGWL. You can find every ticker in the exchanges and tickers section below.
In this article we compare the two classes on costs, index tracking, portfolio composition, dividends and risk, using the Vanguard factsheets of 31 July 2026.
Key data
| ETF | VWCE | VWRL |
| Share class | Accumulating | Distributing |
| ISIN | IE00BK5BQT80 | IE00B3RBWM25 |
| Asset manager | Vanguard | Vanguard |
| Index tracked | FTSE All-World | FTSE All-World |
| Inception date | 23 July 2019 | 22 May 2012 |
| Share class assets | $53,365 million | $26,188 million |
| Fund assets (both classes) | $79,553 million | $79,553 million |
| Fund currency | USD | USD |
| Replication | Physical, representative sampling | Physical, representative sampling |
| Number of holdings | 3,782 | 3,782 |
| Ongoing charges (TER) | 0.14% p.a. | 0.14% p.a. |
| Fund domicile | Ireland | Ireland |
| Dividends | Reinvested in the fund | Paid out quarterly |
Source: Vanguard factsheets (31 July 2026).
VWCE vs VWRL at a glance
| Dividends | The only structural difference: VWCE reinvests them, VWRL pays them out four times a year |
| Performance | Identical on a total return basis. Vanguard reports the same annual returns for both classes |
| Index tracking | Both returned 22.05% in the year to 31 July 2026, against 22.03% for the FTSE All-World Index |
| TER | 0.14% a year in both classes. Paying dividends out costs nothing extra |
| Portfolio structure | The same 3,782 holdings, in the same weights, because it is the same fund |
| Fund size | VWCE is the larger class, with $53.4 billion against $26.2 billion in VWRL |
| Risk statistics | Same portfolio, so the same market risk and the same drawdowns |
Source: Vanguard factsheets (31 July 2026).
Comparison: VWCE vs VWRL
We begin with the comparative study between VWCE and VWRL. The metrics we are going to evaluate are the following:
- Share class and dividend policy
- Performance
- Index tracking
- TER
- Portfolio structure
- Risk statistics
As stated at the beginning of the article, both tickers belong to the same fund. That means most of these metrics are the same by construction, so the share class is the factor that actually separates them.
Performance
The chart below compares the two share classes since the launch of the younger one, VWCE, in July 2019 (total return).
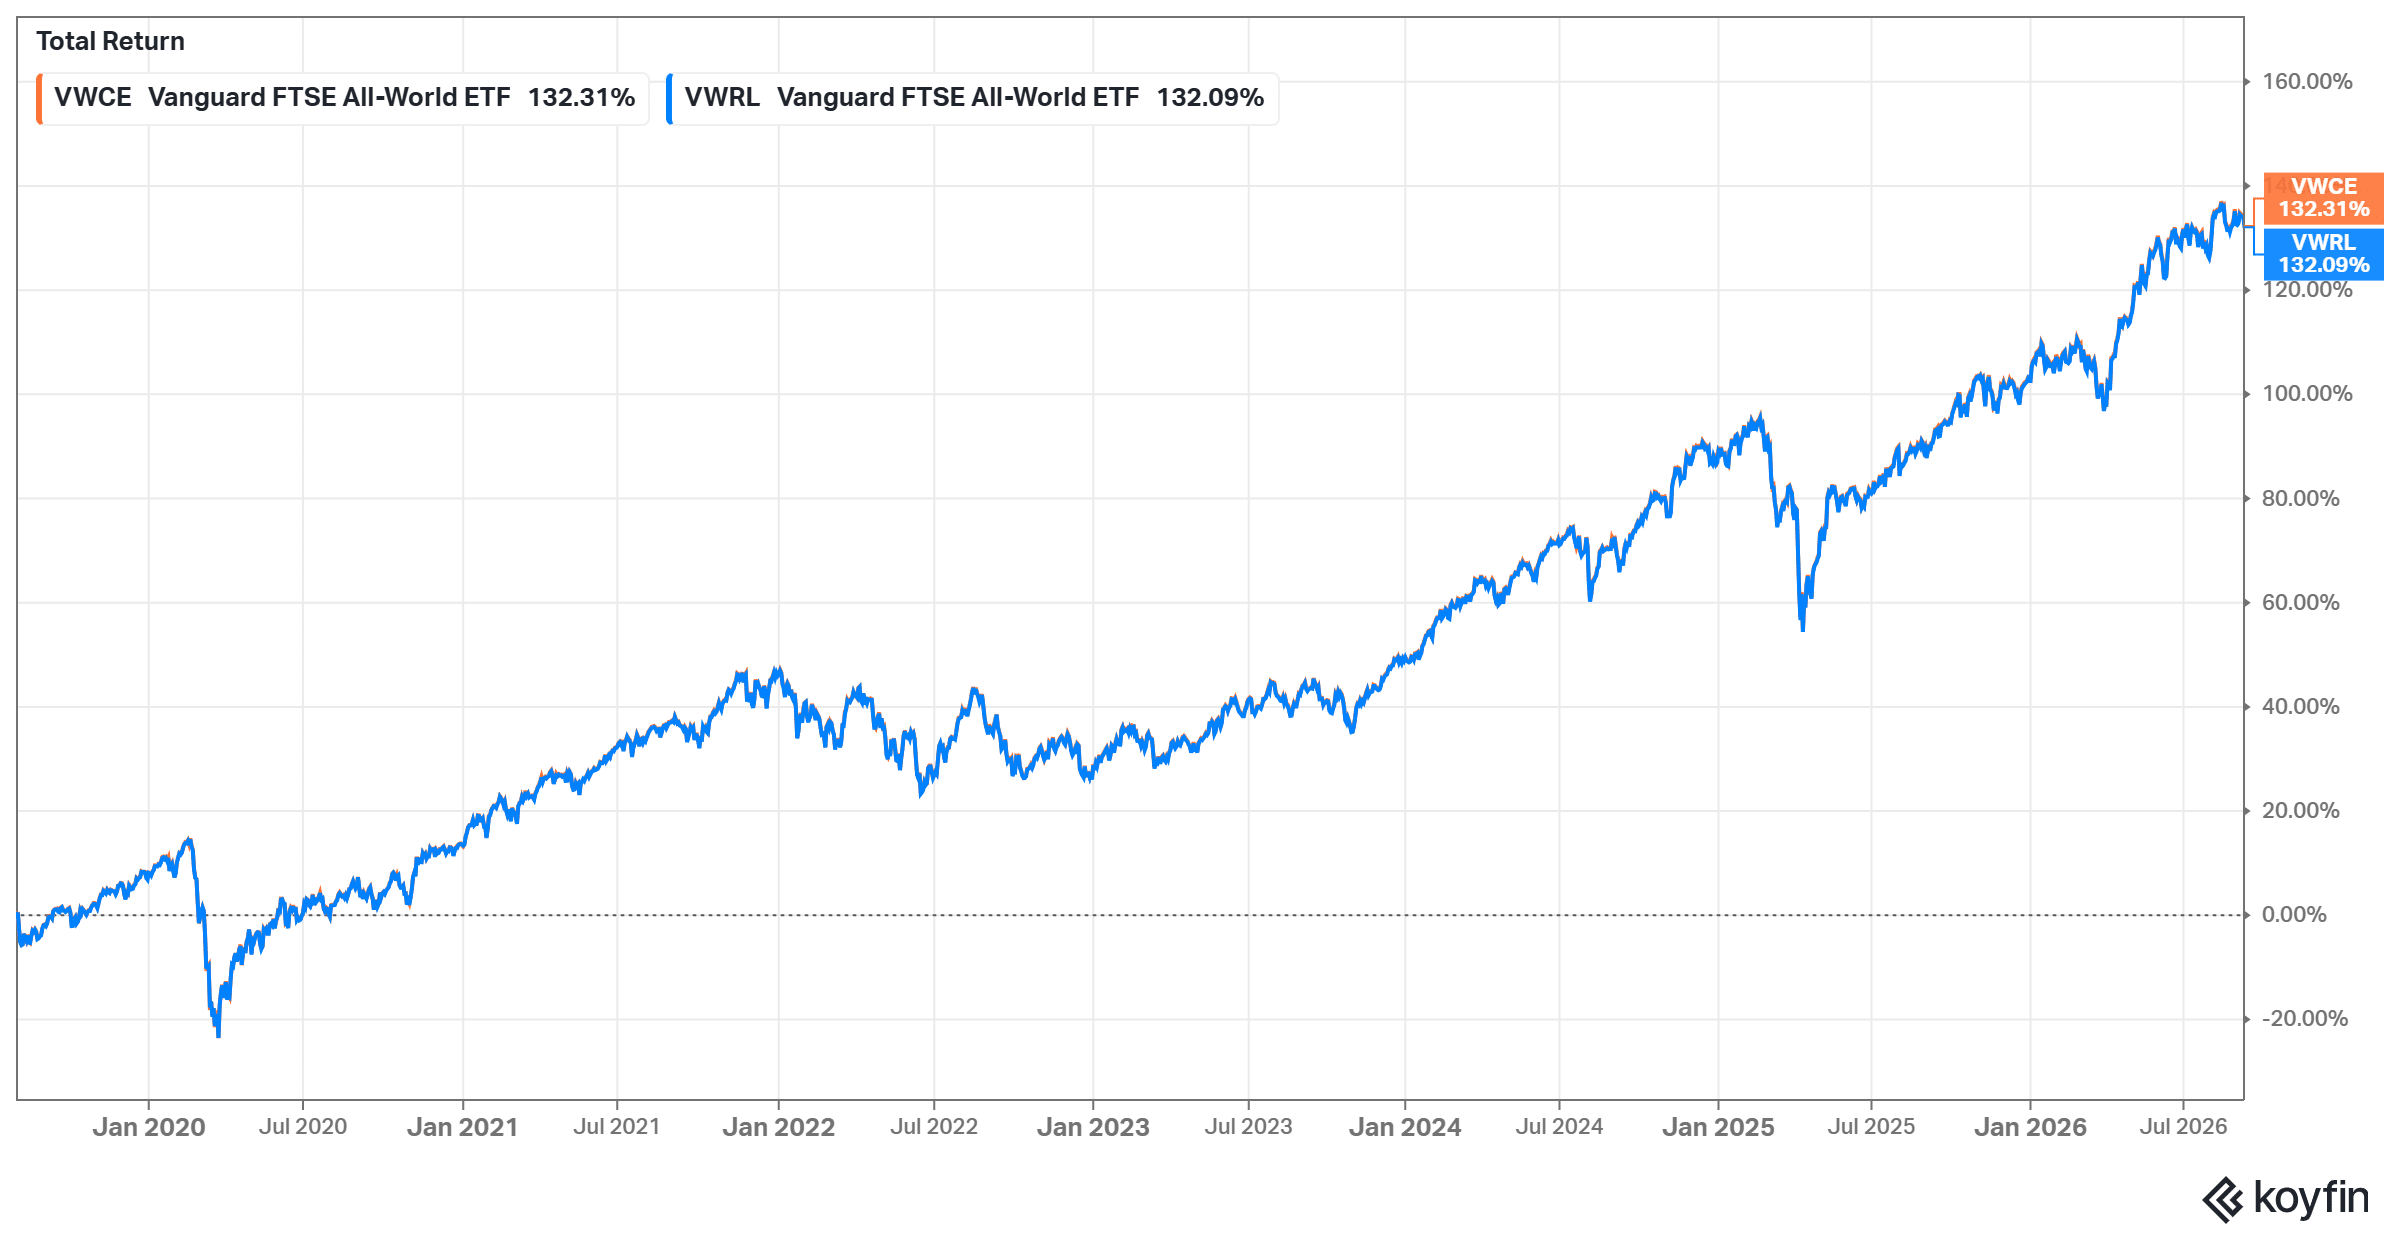
On a total return basis the two lines sit on top of each other, because the fund is the same and the dividends are simply reinvested in one class and paid out in the other. The difference you see on a price chart, where VWRL appears to lag, comes from the ex-dividend date: the price of VWRL falls by roughly the amount distributed, since that money has left the fund and gone to shareholders. VWCE keeps it inside, so its price carries the income with it.
The annual returns published by Vanguard confirm it. The figures are identical in both share classes, because fund performance is measured with all income reinvested.
| Year | VWCE | VWRL | FTSE All-World Index |
| 2016 | n.a. | 7.98% | 8.00% |
| 2017 | n.a. | 23.98% | 23.97% |
| 2018 | n.a. | -9.62% | -9.57% |
| 2019 | n.a. | 26.57% | 26.52% |
| 2020 | 15.99% | 15.99% | 16.01% |
| 2021 | 18.33% | 18.33% | 18.40% |
| 2022 | -18.08% | -18.08% | -18.07% |
| 2023 | 22.03% | 22.03% | 22.00% |
| 2024 | 17.19% | 17.19% | 17.20% |
| 2025 | 22.56% | 22.56% | 22.62% |
Source: Vanguard factsheets (31 July 2026). Calendar year returns in USD, net of fees, with all dividends reinvested. VWCE was launched on 23 July 2019, so it has no full calendar year before 2020.
Past performance is not a reliable indicator of future results, and these returns may not be repeated.
Index tracking
An index fund is judged by how closely it follows its benchmark. The simplest way to see that is to put the fund return next to the index return over the same periods, as Vanguard does in the factsheet. A fund that trails the index by roughly its TER, and no more, is doing its job.
| Period | VWCE | VWRL | FTSE All-World Index |
| 1 year | 22.05% | 22.05% | 22.03% |
| 3 years (annualised) | 18.27% | 18.27% | 18.29% |
| 5 years (annualised) | 10.84% | 10.84% | 10.85% |
| 10 years (annualised) | n.a. | 12.26% | 12.27% |
Source: Vanguard factsheets (31 July 2026). Returns in USD, net of fees, to 31 July 2026. VWCE has no 10 year record because it was launched in July 2019.
The gaps are of a few hundredths of a percentage point, in both directions. Since launch, VWCE has returned 13.01% a year against 13.02% for the index, and VWRL, which goes back to 2012, has returned 11.65% a year against 11.65% for the index. Part of the reason the fund keeps up despite its fees is that it does not buy every constituent: it uses representative sampling, holding 3,782 of the 4,264 stocks in the index, which keeps trading costs down.
TER (total expense ratio)
The TER, which Vanguard calls the ongoing charges figure (OCF), covers most of the running costs of the ETF: management, administration, audit, depositary, legal and regulatory expenses. It does not include the transaction costs the fund pays when it trades. Because the fee is deducted daily from the net asset value, the lower it is, the better.
| ETF | VWCE | VWRL |
| Ongoing charges (TER) | 0.14% p.a. | 0.14% p.a. |
| Cost on $10,000 invested | About $14 a year | About $14 a year |
Source: Vanguard factsheets (31 July 2026).
The figure is the same in both classes, so distributing the dividends carries no extra charge. Worth noting for anyone who follows this fund: the ongoing charges figure was cut from 0.19% to 0.14% a year, so older articles and screenshots still showing 0.19% are out of date.
Portfolio structure
VWCE and VWRL share the same investments and the same weights, so the interesting comparison here is the fund against its benchmark.
| Characteristic | Fund | FTSE All-World Index |
| Number of stocks | 3,782 | 4,264 |
| Median market cap | $184.6 billion | $185.4 billion |
| Price/earnings ratio | 21.1x | 21.0x |
| Price/book ratio | 3.5x | 3.5x |
| Return on equity | 18.7% | 18.7% |
| Earnings growth rate | 19.8% | 19.8% |
| Equity yield (dividend) | 1.5% | 1.5% |
Source: Vanguard (31 July 2026).
The main difference between the fund and the index is the number of holdings. The fund buys a representative selection of the index constituents, also called optimised sampling, which is why it holds 3,782 stocks against 4,264 in the benchmark. The valuation and profitability metrics barely move because of it: the sample is chosen to behave like the whole.
By sector, technology dominates, followed by financials. Vanguard uses the ICB classification, which places companies such as Alphabet and Meta in technology rather than in communications.
| Sector | Weight |
| Technology | 33.4% |
| Financials | 15.7% |
| Industrials | 12.6% |
| Consumer Discretionary | 11.3% |
| Health Care | 7.9% |
| Energy | 4.1% |
| Consumer Staples | 4.0% |
| Telecommunications | 3.3% |
| Basic Materials | 3.1% |
| Utilities | 2.7% |
| Real Estate | 1.8% |
Source: Vanguard (31 July 2026). Sectors follow the Industry Classification Benchmark (ICB).
By country, the United States takes the largest share by a wide margin, followed by Japan and the United Kingdom. Because the index covers emerging markets too, Taiwan, China and Korea appear in the top 10.
| Country | Weight |
| United States | 61.6% |
| Japan | 6.0% |
| United Kingdom | 3.3% |
| Taiwan | 3.2% |
| Canada | 3.0% |
| China | 2.8% |
| Korea | 2.4% |
| France | 2.1% |
| Switzerland | 2.0% |
| Germany | 1.9% |
| Other markets | 11.7% |
Source: Vanguard (31 July 2026). “Other markets” is the remainder outside the 10 largest allocations.
Risk statistics
Since both classes hold the same portfolio, they carry the same market risk. The numbers below are for the distributing class in euros, and the accumulating class behaves in the same way.
| Metric | 1 year | 3 years | 5 years |
| Volatility (annualised) | 10.30% | 12.28% | 13.70% |
| Return per unit of risk | 1.98 | 1.42 | 0.83 |
| Maximum drawdown | -6.92% | -19.59% | -19.59% |
Source: justETF (September 2026), figures in EUR for the distributing share class. Maximum drawdown since inception: -33.48%.
Two takeaways. First, volatility of 10% to 14% a year is normal for a global equity fund and says nothing about which class to pick. Second, the worst fall since launch was about a third of the value of the fund, which is the kind of drop a global equity investor should expect to sit through at some point. Choosing the distributing class does not soften it: a dividend is money taken out of the same pot.
What is VWCE?
VWCE is the ticker of the “Vanguard FTSE All-World UCITS ETF (USD) Accumulating” on the European exchanges that quote it in euros. It is managed by Vanguard, tracks the FTSE All-World Index and was launched on 23 July 2019.
The ETF replicates the index physically, buying a representative sample of its constituents, and pays no dividends: the income received is reinvested inside the fund. At 31 July 2026 this share class held $53,365 million, making it the larger of the two.
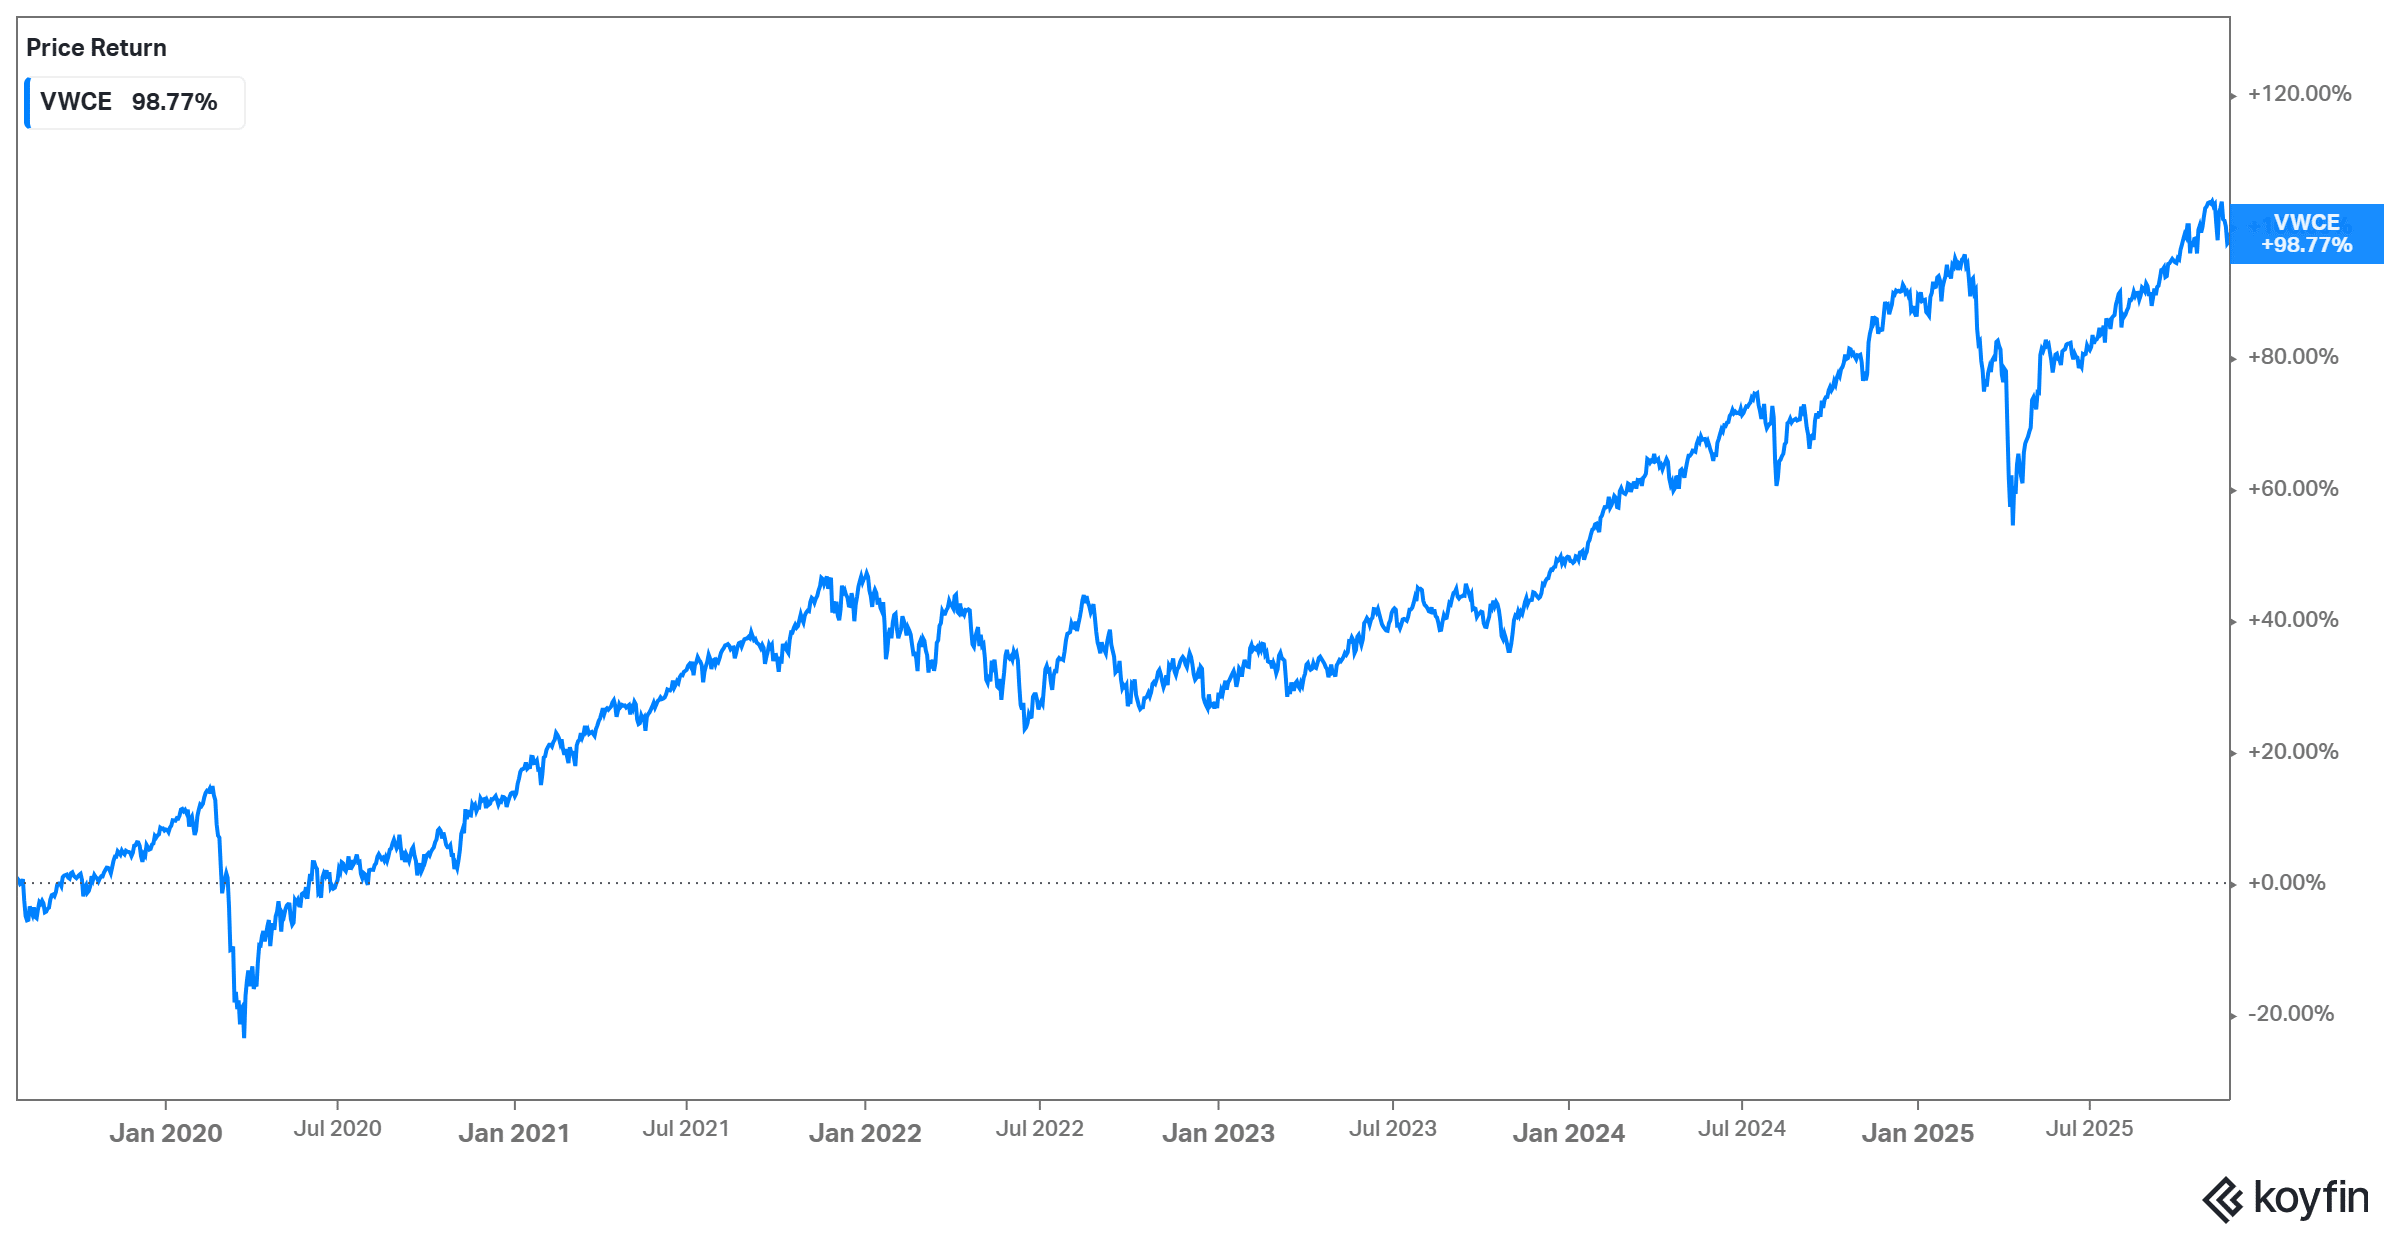
Since launch it has returned 13.01% a year, net of fees, against 13.02% a year for the index.
What is VWRL?
VWRL is the ticker of the “Vanguard FTSE All-World UCITS ETF (USD) Distribution“, the same fund managed by Vanguard, launched on 22 May 2012. This is the distributing share class, so it pays dividends four times a year. At 31 July 2026 it held $26,188 million.
The table below shows what the ETF actually paid out per share, and the yield those payments represented, for the euro listing.
| Period | Dividend per share | Dividend yield |
| 2022 | €1.95 | 1.79% |
| 2023 | €1.87 | 2.01% |
| 2024 | €1.95 | 1.81% |
| 2025 | €2.01 | 1.52% |
| Last 12 months | €2.01 | 1.48% |
Source: justETF (September 2026), euro listing of the distributing share class.
Two details are worth keeping in mind. The yield falls when prices rise faster than the dividends, which is what happened in 2025. And the 1.5% equity yield you see in the Vanguard factsheet is the dividend yield of the companies held by the fund, not the yield you receive, since the fund pays its own costs before distributing anything.
Exchanges and tickers
Each share class is listed on several exchanges and in several currencies, and each listing has its own ticker. This is where most of the confusion around these ETFs comes from: VWCE, VWRA and VWRP are the same accumulating share class, and VWRL, VWRD and VGWL are the same distributing share class.
| Exchange | Trading currency | Accumulating | Distributing |
| London Stock Exchange | GBP | VWRP | VWRL |
| London Stock Exchange | USD | VWRA | VWRD |
| SIX Swiss Exchange | CHF | VWRA | VWRL |
| Euronext Amsterdam | EUR | VWCE | VWRL |
| Deutsche Börse (Xetra) | EUR | VWCE | VGWL |
| Borsa Italiana | EUR | VWCE | VWRL |
Source: Vanguard factsheets (31 July 2026).
The trading currency does not change what you own. The fund currency is USD and the ETF is unhedged, so your exposure is to the currencies of the companies inside it, whichever listing you buy. Buying the euro line instead of the dollar line only spares you the currency conversion your broker would charge, which is usually the reason European investors pick VWCE or VWRL in euros.
About the index
Both share classes track the FTSE All-World Index, built by FTSE Russell. It is made up of large and mid-cap companies from developed and emerging markets in more than 45 countries.
The index is the large and mid-cap slice of the FTSE Global Equity Index Series (GEIS), and FTSE Russell describes it as representing around 90% to 95% of the world’s investable market capitalisation. At 31 July 2026 it had 4,264 constituents. What it leaves out is small caps, which sit in the wider FTSE Global All Cap Index.
Top 10 holdings
With VWCE and VWRL you own companies such as NVIDIA, Apple, Alphabet, Microsoft and JPMorgan Chase, alongside non-US names such as Taiwan Semiconductor and Samsung Electronics. The 10 largest positions are identical in both classes.
| Company | Weight |
| NVIDIA | 4.5% |
| Apple | 4.3% |
| Alphabet | 3.6% |
| Microsoft | 3.3% |
| Amazon.com | 2.5% |
| Taiwan Semiconductor Manufacturing | 1.7% |
| Broadcom | 1.7% |
| Meta Platforms | 1.2% |
| Samsung Electronics | 0.9% |
| JPMorgan Chase | 0.9% |
Source: Vanguard (31 July 2026). The top 10 holdings represent about 24.6% of net assets.
About the investment manager
Both share classes belong to Vanguard Funds plc, an Irish UCITS authorised by the Central Bank of Ireland and managed by Vanguard Group (Ireland) Limited.
Vanguard was founded in 1975 by John Bogle and is the second largest asset manager in the world, behind BlackRock, with around $11.6 trillion under management as of September 2025 and roughly 20,000 employees. It is owned by its own funds, and therefore by the investors in them, which is the structure it credits for its low fees.
Sources: Vanguard factsheets (31 July 2026) and Vanguard corporate data (AUM as of 30 September 2025).
Cheapest brokers to invest in VWCE and VWRL
If one of these share classes fits your portfolio, the next question is where to buy it. Below is a selection of three well known online brokers that give European investors access to both listings.
| Broker | ETF transaction fees | Other fees to watch | Regulators |
| DEGIRO | €1 handling fee on ETFs in the Core Selection, traded on Tradegate. €3 on other exchanges (€2 commission plus the €1 handling fee) | 0.25% AutoFX currency conversion, €2.50 a year connectivity fee per exchange outside the Core Selection | flatexDEGIRO Bank SE, supervised by BaFin |
| Interactive Brokers | 0.05% of trade value on European exchanges, with a minimum of €3 per order on Fixed pricing and €1.25 on Tiered pricing (capped at €29) | Currency conversion and market data subscriptions | Interactive Brokers Ireland Limited, authorised by the Central Bank of Ireland |
| Trading 212 | No commissions on stocks and ETFs. Other fees may apply. See terms and fees | 0.15% currency conversion fee, 0.7% fee on card deposits above €2,000 | Trading 212 UK Ltd (FCA), Trading 212 Markets Ltd (CySEC) and Trading 212 EU GmbH (BaFin) |
Source: DEGIRO, Interactive Brokers and Trading 212 fee schedules (September 2026). Fees can differ between the country entities of each broker, so check the schedule that applies to you.
Disclaimer: When investing, your capital is at risk and you may get back less than invested. Past performance doesn’t guarantee future results.
Conclusion
VWCE and VWRL give you the same portfolio, the same index, the same manager and the same 0.14% a year. The decision is only about what you want the dividends to do.
If you are building capital over the long term and have no use for the cash, VWCE does the reinvesting for you, with no dealing commission and nothing to remember four times a year.
If you want periodic income while your capital stays invested, VWRL pays it out quarterly. The last 12 months produced €2.01 per share, a yield of about 1.5%, and that money arrives whether the market is up or down.
Then check your local tax rules before you buy, because in several countries they are what actually separates the two classes.
If you are still deciding which global index to follow, we also compared the FTSE All-World against the MSCI World in our VWRA vs IWDA article.