In the world of ETFs, choosing between global diversification and US market focus can be challenging. Whether you’re a seasoned investor or just starting, selecting the right ETF is crucial for your portfolio’s success.
Two popular ETFs from Vanguard often compared are VWCE (Vanguard FTSE All-World UCITS ETF) and VUAA (Vanguard S&P 500 UCITS ETF). Each has its strengths, but which one fits your investment strategy?
In this article we break down their key differences and performance data, using the funds’ own July 2026 factsheets, to help you decide which ETF aligns with your financial goals.
Overview
| ETFs | VWCE | VUAA |
| Asset manager | Vanguard | Vanguard |
| Replicated index | FTSE All-World Index | S&P 500 Index |
| ISIN | IE00BK5BQT80 | IE00BFMXXD54 |
| Fund assets | $79.55B (of which $53.37B in this share class) | $86.04B (of which $34.18B in this share class) |
| Inception date | 23/07/2019 | 14/05/2019 |
| Fund currency | USD | USD |
| Domicile | Ireland | Ireland |
| Replication | Physical (sampling) | Physical (full or near-full) |
| Dividends | Accumulating | Accumulating |
| TER | 0.14% p.a. | 0.07% p.a. |
Fund data as at 31 July 2026, from the Vanguard factsheets. Fund assets cover every share class of each ETF, so the figure in brackets is the size of the USD accumulating share class most European investors buy.
What are the VWCE and the VUAA?
VWCE
The VWCE ETF, whose full name is “Vanguard FTSE All-World UCITS ETF USD Accumulation”, replicates the FTSE All-World Index and was launched in July 2019.
This ETF uses an optimized physical replication strategy, investing in a representative sample of the index’s securities. As at 31 July 2026, VWCE held 3,782 stocks against 4,264 in the index itself, covering both developed and emerging markets.
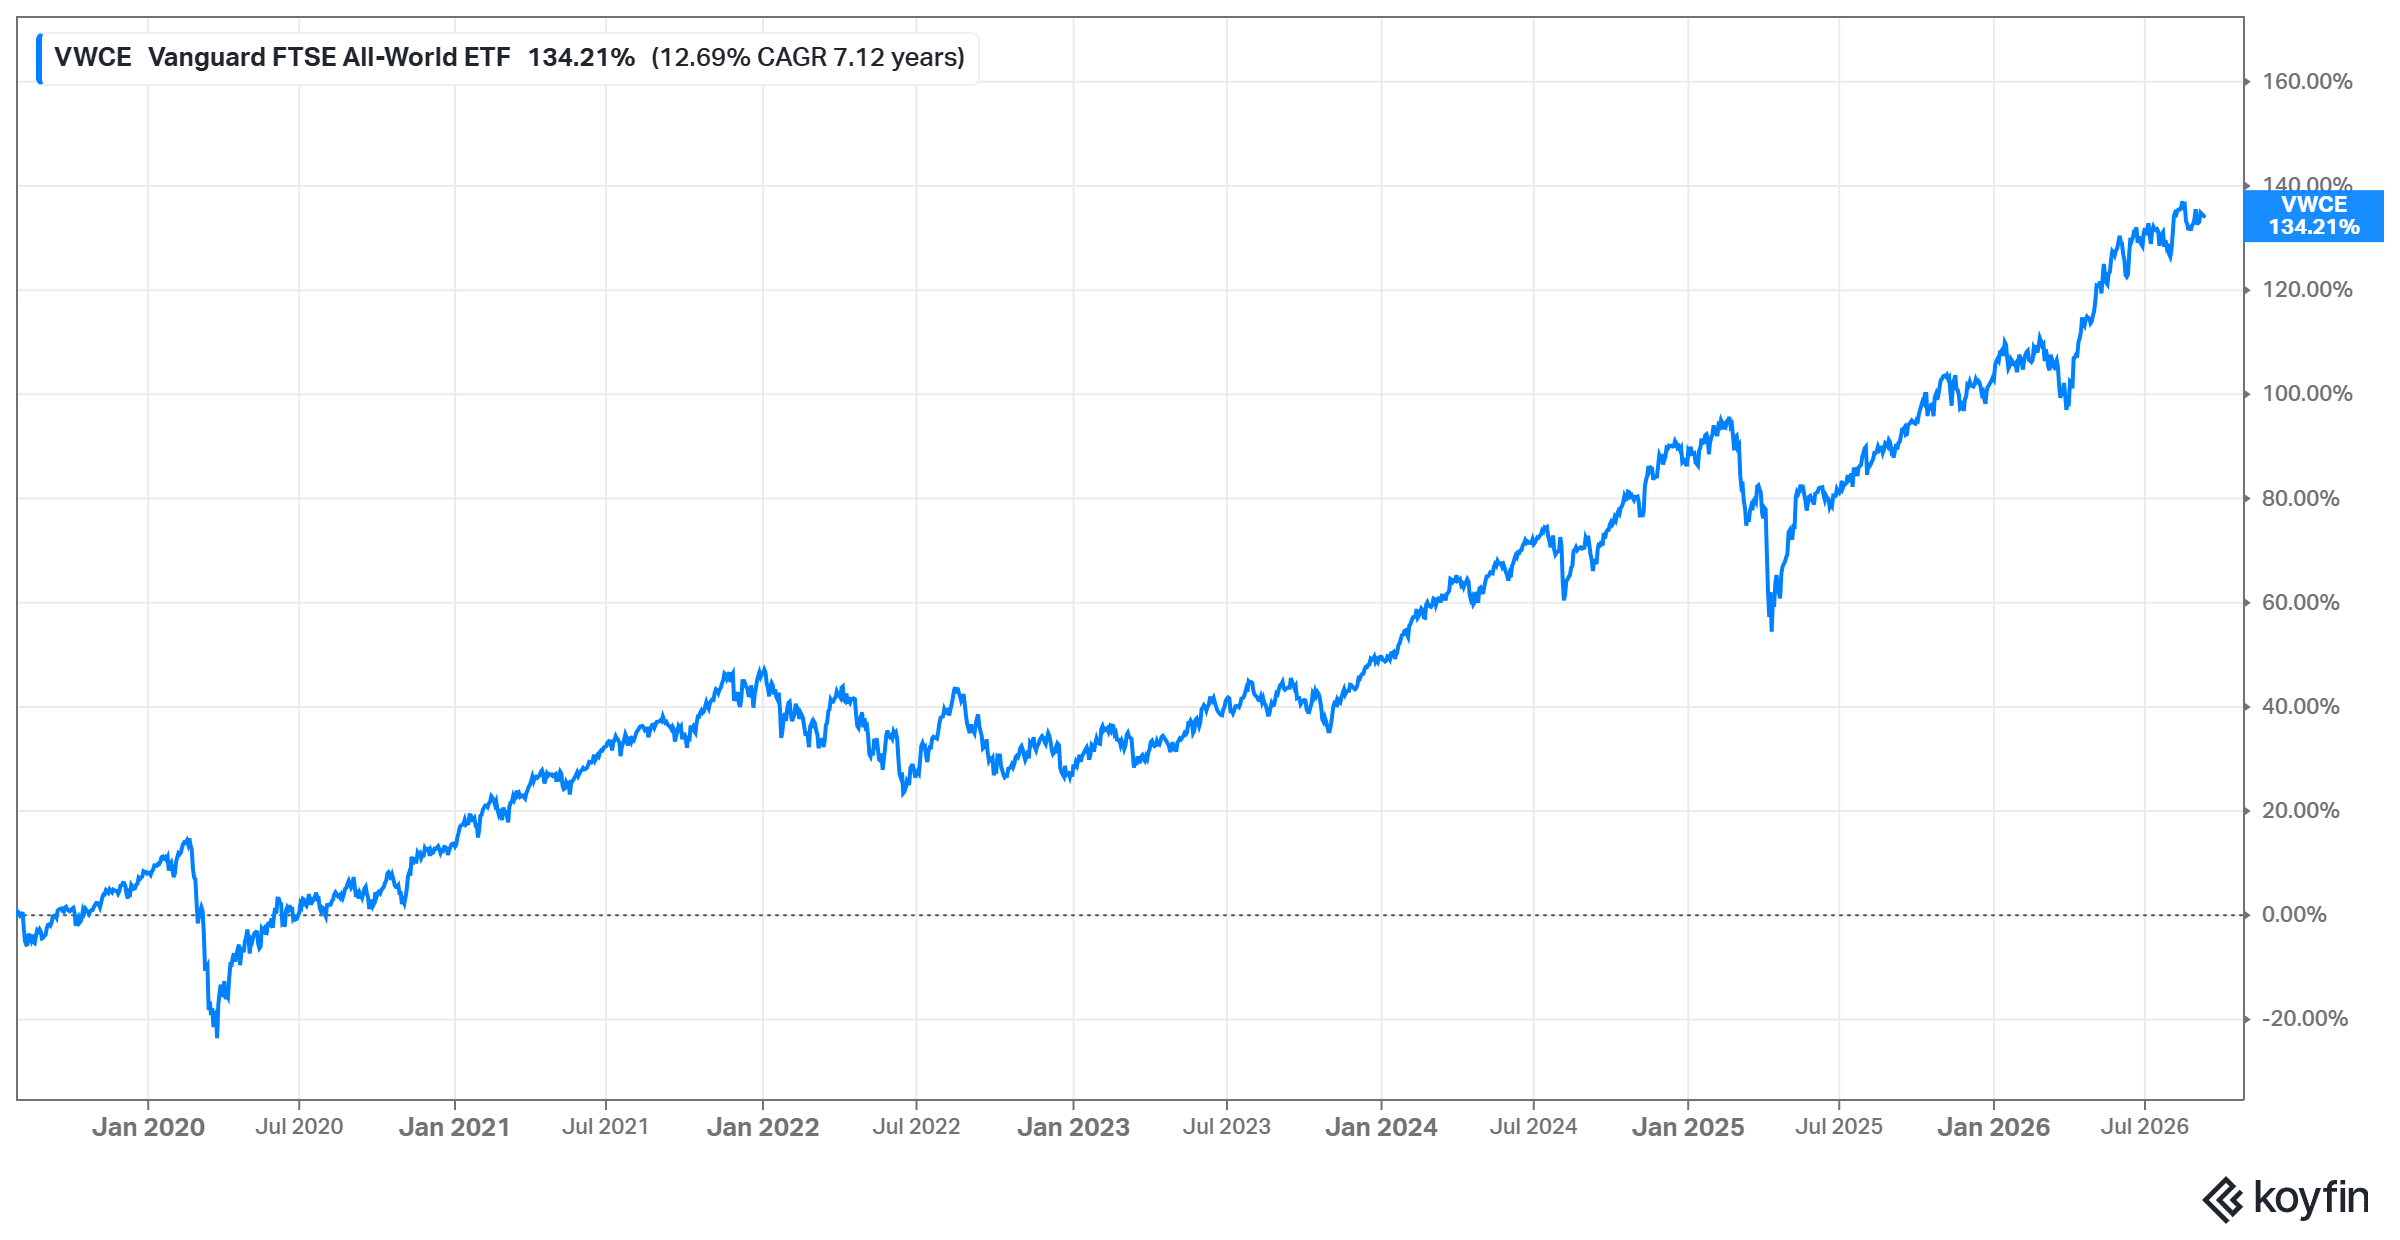
Since its inception in July 2019, VWCE has returned 134.21% in total, equal to 12.69% a year over 7.12 years to 8 September 2026.
VUAA
The VUAA ETF, or “Vanguard S&P 500 UCITS ETF USD Accumulation”, tracks the S&P 500 Index, offering exposure to the 500 largest companies in the United States.
Unlike VWCE, VUAA buys all, or substantially all, of the index constituents in the same proportion as the index, using sampling only where full replication is impractical. As at 31 July 2026 it held 504 stocks.
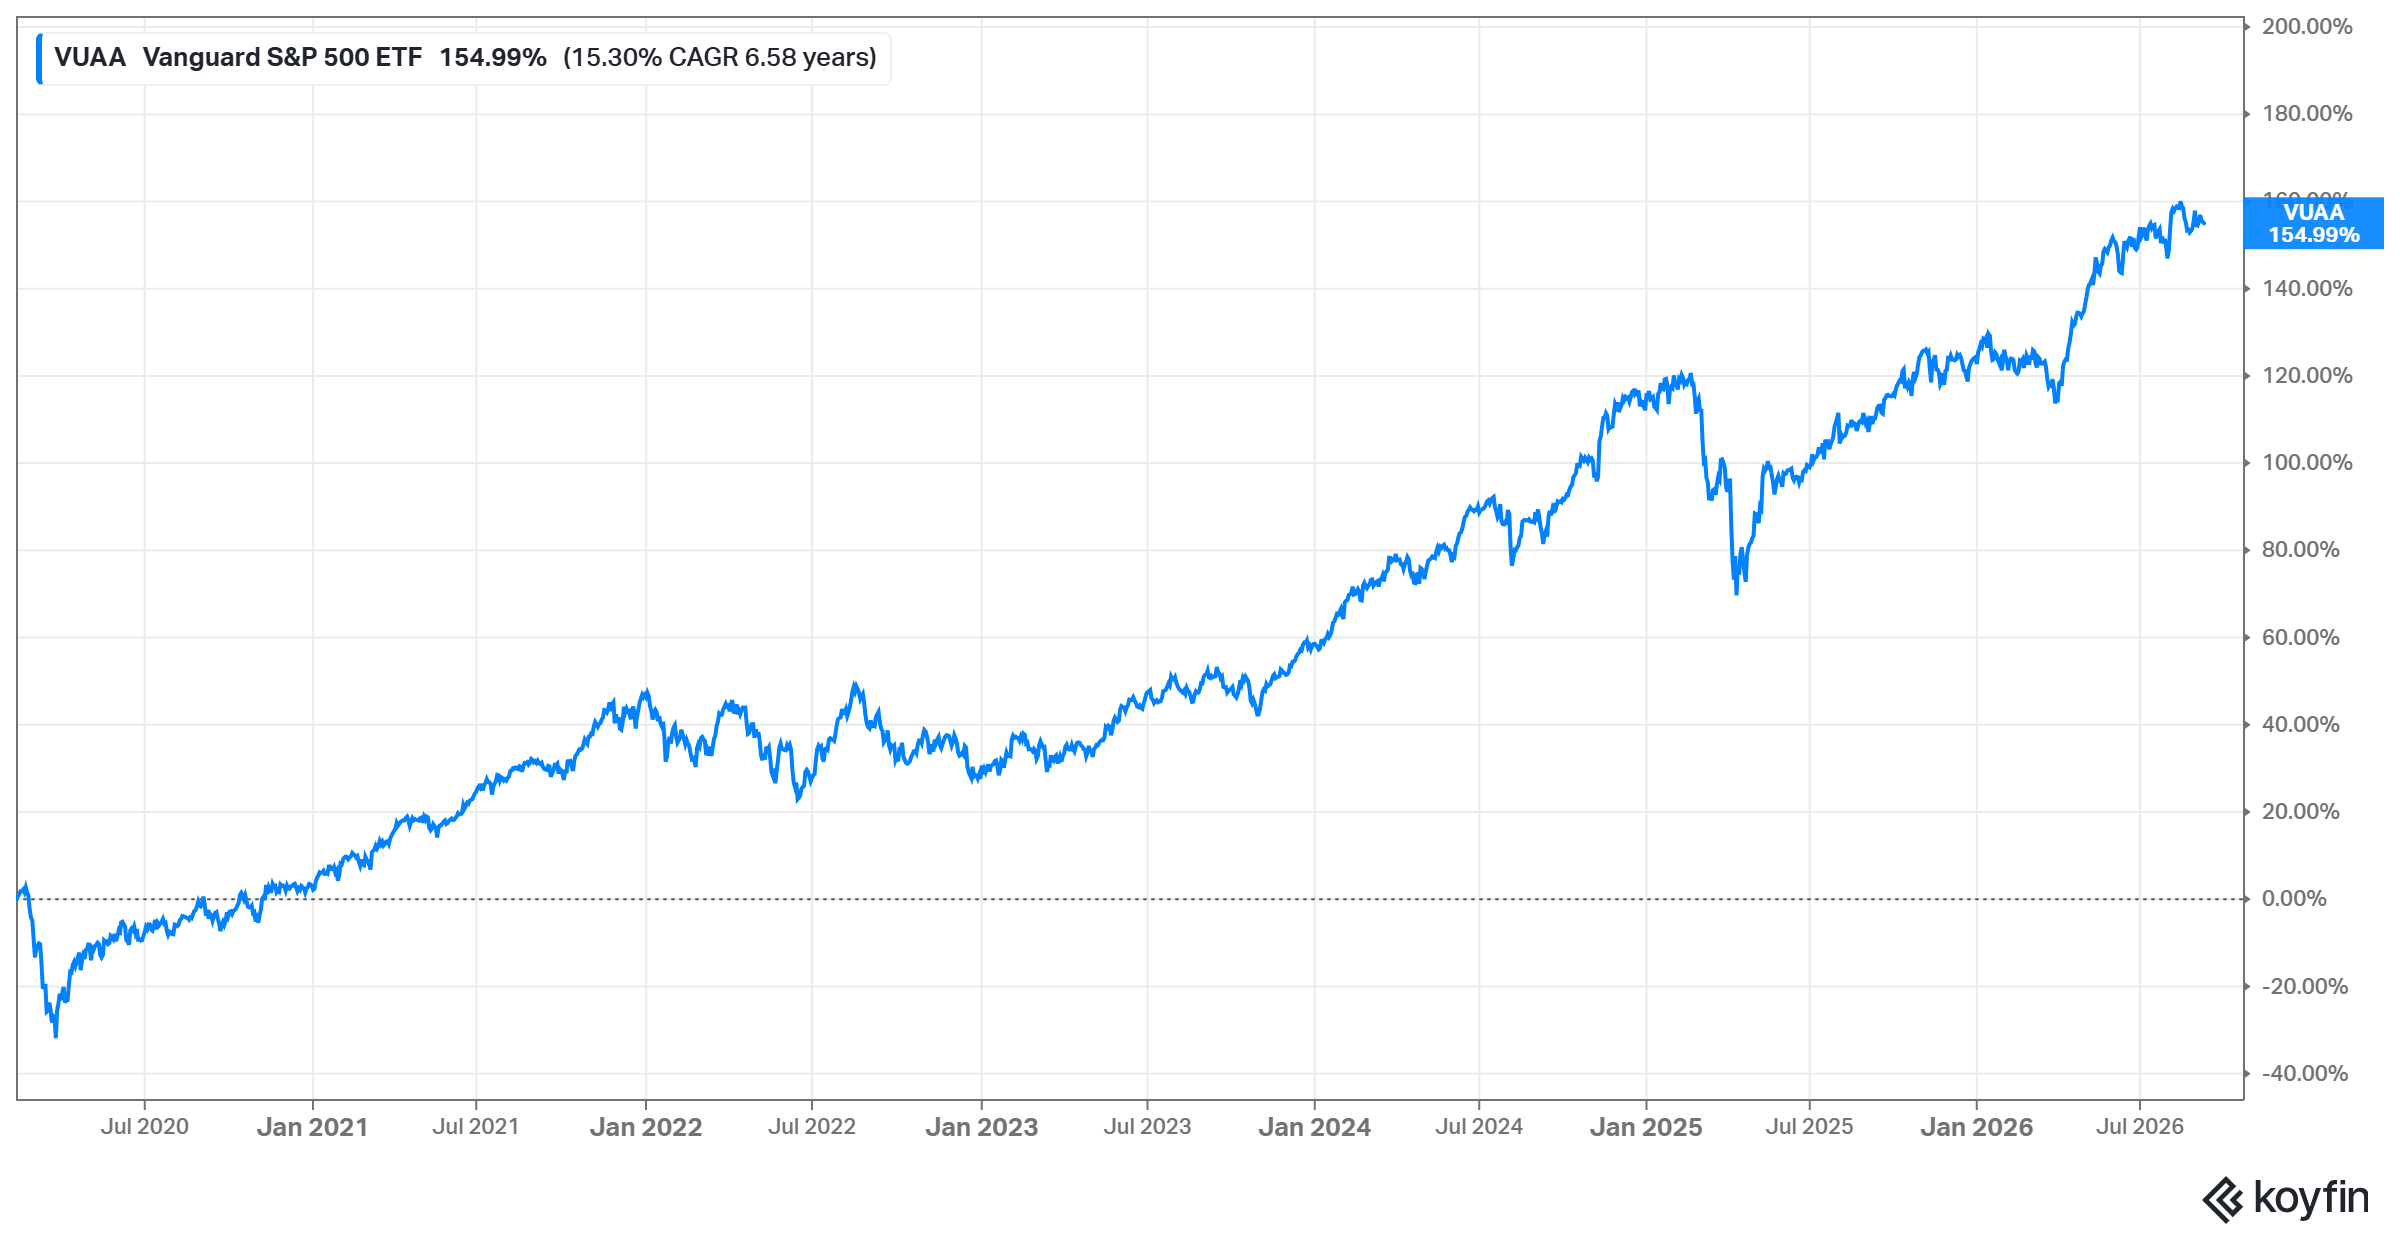
Over the 6.58 years to 8 September 2026, VUAA has returned 154.99% in total, equal to 15.30% a year.
We now move on to the comparative study between VWCE and VUAA, in which we will take into account different aspects, namely:
| Performance: | Over five years and since launch, VUAA has been the stronger performer. Over the 12 months to 31 July 2026, VWCE came out ahead. |
| TER: | VUAA has the lower TER, 0.07% against 0.14%, which makes it the cheaper fund to hold. |
| Portfolio structure: | The style of the stocks is similar. VWCE adds developed and emerging markets outside the US, while VUAA is concentrated in US large caps. |
Geographic distribution
VWCE
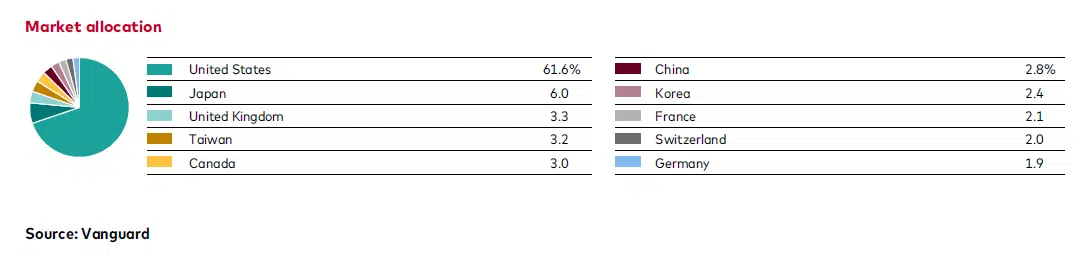
For VWCE, the geographic allocation is led by the United States, at 61.6% of the portfolio. Japan follows with 6.0%, then the United Kingdom (3.3%), Taiwan (3.2%) and Canada (3.0%).
Below is VWCE’s top 10 market breakdown as at 31 July 2026 (factsheet):
| Market | Weight |
| United States | 61.6% |
| Japan | 6.0% |
| United Kingdom | 3.3% |
| Taiwan | 3.2% |
| Canada | 3.0% |
| China | 2.8% |
| Korea | 2.4% |
| France | 2.1% |
| Switzerland | 2.0% |
| Germany | 1.9% |
VUAA
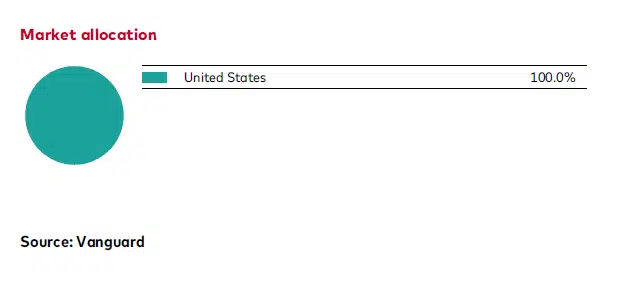
VUAA is entirely focused on the US market, tracking the S&P 500 Index, which includes 500 of the largest publicly traded companies in the United States.
As at 31 July 2026, 100% of VUAA’s portfolio is allocated to US companies, with no international exposure. Below is the geographic breakdown for VUAA (factsheet):
Sector diversification
Both VWCE and VUAA are diversified across a range of sectors, but there are notable differences in their allocations. Technology leads the way in both portfolios, and it plays a larger role in VUAA because of its focus on the US market. Other sectors, such as Industrials and Financials, carry more weight in VWCE, reflecting the two funds’ distinct geographic exposures.
Below is a breakdown of the sector allocations for VWCE and VUAA:
| Sector | VWCE | VUAA |
| Technology / Information Technology | 33.4% | 36.6% |
| Financials | 15.7% | 12.5% |
| Industrials | 12.6% | 8.7% |
| Consumer Discretionary | 11.3% | 9.4% |
| Health Care | 7.9% | 9.1% |
| Energy | 4.1% | 3.4% |
| Consumer Staples | 4.0% | 4.7% |
| Telecommunications / Communication Services | 3.3% | 9.9% |
| Basic Materials / Materials | 3.1% | 1.8% |
| Utilities | 2.7% | 2.1% |
| Real Estate | 1.8% | 1.9% |
Weights as at 31 July 2026. Vanguard classifies VWCE under ICB and VUAA under GICS, so the two columns are close but not strictly like-for-like. ICB “Telecommunications” is a narrower bucket than GICS “Communication Services”, which is why the gap in that row looks wider than the underlying difference.
Portfolio structure
Regarding the number of holdings, VWCE offers a broader range, with 3,782 stocks covering both developed and emerging markets. In contrast, VUAA holds 504 stocks, focusing exclusively on large-cap companies in the US.
Concentration is where the two really separate. VWCE’s ten largest positions account for 24.6% of the fund, against 39.1% for VUAA. Both funds are led by the same handful of US mega caps, but VUAA gives them roughly half as much weight again.
It is also worth noting that VWCE tracks an index of 4,264 constituents with 3,782 holdings, because it samples rather than buying every name. VUAA replicates its index almost in full.
Top 10 holdings
| VWCE | VUAA | ||
| Stocks | Weights | Stocks | Weights |
| NVIDIA Corp | 4.5% | NVIDIA Corp | 7.6% |
| Apple Inc | 4.3% | Apple Inc | 7.1% |
| Alphabet Inc | 3.6% | Alphabet Inc | 5.9% |
| Microsoft Corp | 3.3% | Microsoft Corp | 5.4% |
| Amazon.com Inc | 2.5% | Amazon.com Inc | 4.1% |
| Taiwan Semiconductor | 1.7% | Broadcom Inc | 2.9% |
| Broadcom Inc | 1.7% | Meta Platforms Inc | 1.9% |
| Meta Platforms Inc | 1.2% | JPMorgan Chase & Co | 1.5% |
| Samsung Electronics | 0.9% | Berkshire Hathaway Inc | 1.5% |
| JPMorgan Chase & Co | 0.9% | Micron Technology Inc | 1.4% |
Weights as at 31 July 2026. The top 10 represents approximately 24.6% of VWCE’s net assets and 39.1% of VUAA’s.
Key characteristics
Beyond costs and country weights, the two portfolios look different on the metrics investors use to judge how expensive a market is:
| Metric | VWCE | VUAA |
| Number of stocks | 3,782 | 504 |
| Median market cap | $184.6B | $434.8B |
| Price/earnings | 21.1x | 25.1x |
| Price/book | 3.5x | 5.2x |
| Return on equity | 18.7% | 29.0% |
| Dividend yield | 1.5% | 1.1% |
| Top 10 weight | 24.6% | 39.1% |
Data as at 31 July 2026. The dividend yield refers to the underlying holdings, not to a payout you receive: both share classes accumulate income inside the fund rather than distributing it.
VUAA holds companies that are larger, more profitable and more expensive on both earnings and book value. VWCE holds the same companies, plus several thousand smaller and cheaper ones outside the US, which pulls every one of those metrics down.
How much do the two overlap?
This is the point most comparisons skip. VWCE and VUAA are not two separate bets, since one largely contains the other.
The United States accounts for 61.6% of VWCE, and eight of the ten largest holdings are the same companies in both funds: NVIDIA, Apple, Alphabet, Microsoft, Amazon, Broadcom, Meta and JPMorgan Chase. What VWCE adds is Japan, Europe, Canada and emerging markets such as Taiwan, China and Korea, plus mid-cap exposure that the S&P 500 does not cover.
The practical consequence: holding both does not diversify you as much as the two names suggest. It mostly increases your weight in US mega caps on top of a portfolio that already leans that way.
Performance
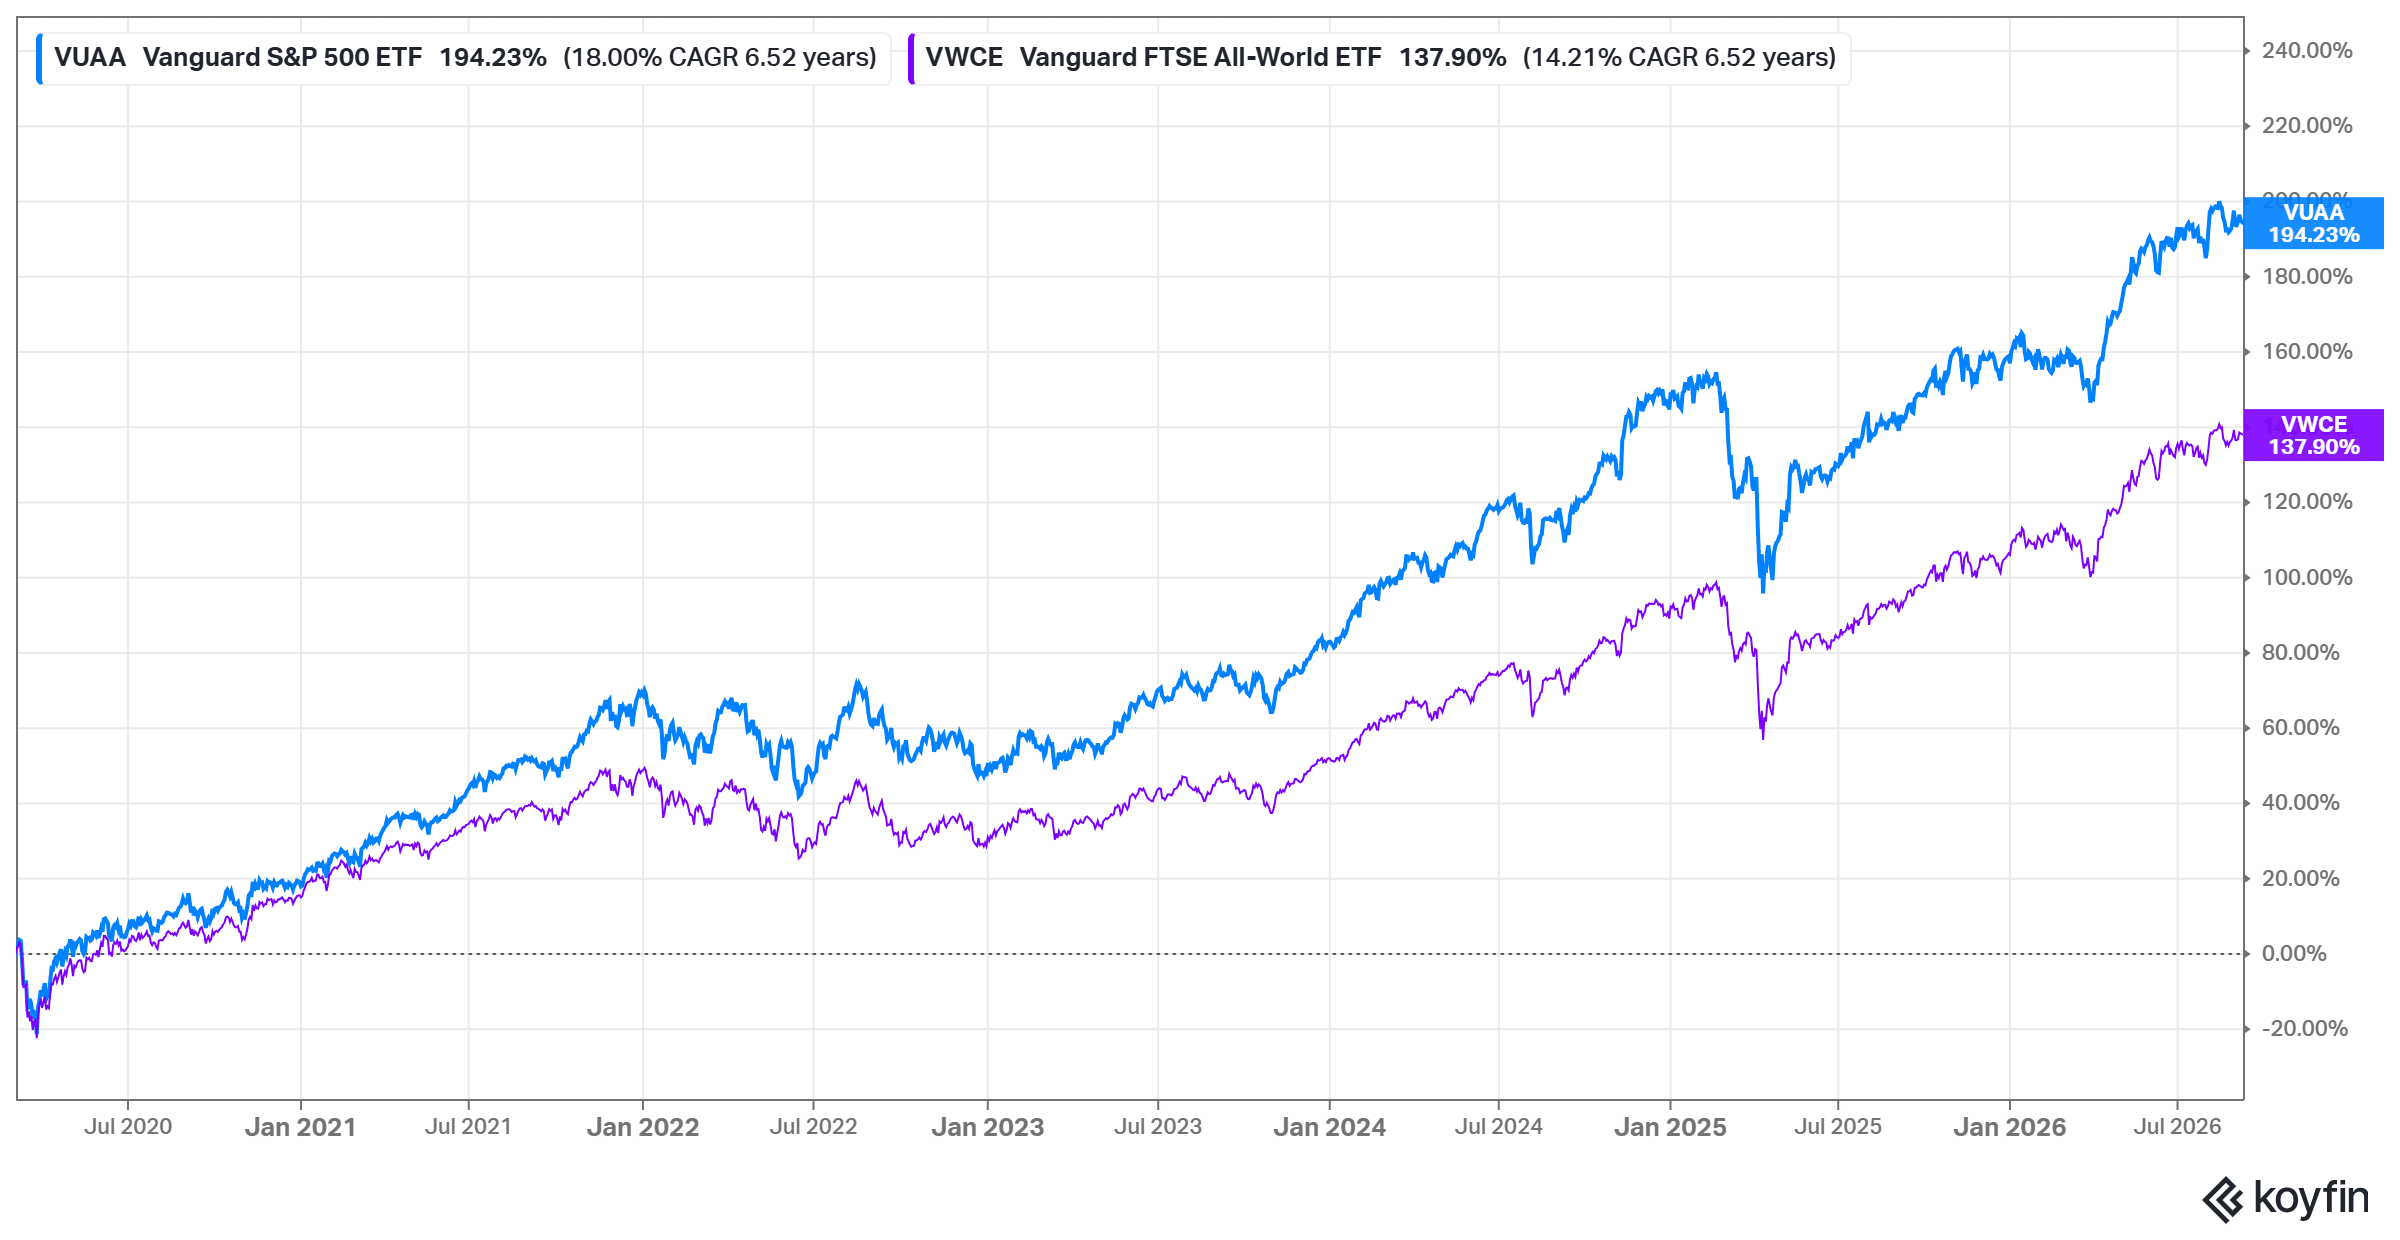
Both funds launched in 2019, which makes their track records broadly comparable, with one caveat: VUAA started on 14 May and VWCE on 23 July, so the since-inception figures cover slightly different periods. The chart below solves that by starting both on the same date.
Over a common 6.52-year window to 8 September 2026, VUAA returned 194.23%, or 18.00% a year, against 137.90% for VWCE, or 14.21% a year. The gap is wide, and it comes almost entirely from the US market outperforming everything else over that period.
Over the most recent 12 months the ranking flipped, with VWCE ahead as markets outside the US caught up. The tables below break that down.
| Period | VWCE | VUAA |
| Year to date | 11.27% | 9.99% |
| 1 year | 22.05% | 19.28% |
| 3 years (p.a.) | 18.27% | 19.01% |
| 5 years (p.a.) | 10.84% | 12.55% |
| Since inception (p.a.) | 13.01% | 15.86% |
Returns to 31 July 2026, net of expenses, calculated in USD. Figures for periods under one year are cumulative, the rest are annualised.
Year by year, the gap has been far from consistent:
| 12 months to July | VWCE | VUAA |
| 2020 | 7.10% | 11.59% |
| 2021 | 33.11% | 36.06% |
| 2022 | -10.42% | -4.90% |
| 2023 | 12.92% | 12.67% |
| 2024 | 16.91% | 21.80% |
| 2025 | 15.93% | 16.03% |
| 2026 | 22.05% | 19.28% |
Rolling 12-month returns, net of expenses, in USD, as reported in the July 2026 factsheets.
Both funds also track their benchmarks closely, which is what you want from an index fund. Over the last 12 months VWCE returned 22.05% against 22.03% for the FTSE All-World Index, and VUAA returned 19.28% against 19.14% for the S&P 500 Net Total Return Index. Note that this S&P benchmark assumes 30% withholding tax on US dividends, while an Irish-domiciled fund is generally taxed at a lower treaty rate, which is part of why VUAA sits slightly above its index rather than below it.
However, it’s important to remember that past performance does not guarantee future results, and these returns may not be sustained over time.
TER (Total Expense Ratio)
The TER represents the total cost of managing an ETF, and a lower TER generally means lower fees for investors. Vanguard reports it as the Ongoing Charges Figure, which covers administration, audit, depository, legal, registration and regulatory expenses on top of the annual management charge.
In the case of VUAA, the TER is 0.07% p.a., whereas for VWCE it is 0.14% p.a. On a €10,000 holding that is roughly €7 a year against €14, so the difference is real but small in cash terms at typical retail balances.
At first glance VUAA appears more cost-effective. It is worth considering that the cost structure of each ETF is influenced by its investment strategy. VUAA invests solely in large-cap US companies, where operational costs are generally lower and currency handling is simpler. VWCE invests across developed and emerging markets, which involves higher costs due to the complexity of managing a globally diversified portfolio across multiple currencies and settlement systems.
Where VWCE and VUAA trade
Both funds are domiciled in Ireland with USD as their base currency, and both are cross-listed on several European exchanges. The ticker you use depends on where your broker routes the order, and the trading currency is not the same as the fund’s currency exposure:
| Exchange | Currency | VWCE | VUAA |
| London Stock Exchange | GBP | VWRP | VUAG |
| London Stock Exchange | USD | VWRA | VUAA |
| SIX Swiss Exchange | CHF | VWRA | – |
| Euronext Amsterdam | EUR | VWCE | – |
| Deutsche Börse | EUR | VWCE | VUAA |
| Borsa Italiana | EUR | VWCE | VUAA |
Listings as shown in the July 2026 factsheets. A dash means the fund is not listed on that exchange according to the factsheet.
Risk factors
While the VWCE and VUAA strategies offer a diversified way to invest, it’s important to understand the associated risks that could affect your investment. Both funds carry a summary risk indicator of 4 out of 7, the middle of the scale used in their Key Information Documents.
-
Market risk and global exposure
Both VWCE and VUAA are equity-focused, making them vulnerable to market volatility. If stock markets fall, these ETFs are likely to incur losses as well. VUAA is concentrated in the US market, which means higher sensitivity to domestic economic shifts, while VWCE‘s global exposure spreads that risk more widely but may still suffer from global downturns. Neither escaped the 2022 drawdown: over the 12 months to July 2022, VWCE fell 10.42% and VUAA 4.90%.
-
Concentration risk
Index investing does not automatically mean broad exposure. The ten largest holdings represent 39.1% of VUAA and 24.6% of VWCE, and they are largely the same technology companies. A sharp correction in US mega caps would move both funds hard.
-
Currency risk
Both funds have USD as their base currency and hold assets denominated mostly in dollars, even though their shares can be traded in EUR, GBP or CHF depending on the exchange. Buying the EUR line does not hedge you: fluctuations in the USD/EUR rate still affect your returns, and a weakening dollar can eat into gains when you convert back.
-
Inflexibility in asset allocation
With VWCE and VUAA, your investment is tied to their respective indices, which limits your ability to tilt towards specific regions or sectors. If you prefer more control over your allocation, these ETFs may not provide the flexibility you need.
Cheapest brokers to invest in VWCE and VUAA
Now that you know the key differences between VWCE and VUAA, it’s time to take the next step and choose the best broker to invest with. To help you make an informed decision, we’ve evaluated and highlighted 5 top European ETF brokers below, each offering unique benefits for different types of investors.
Here’s a look at the top five ETF brokers in Europe and why they might be the right fit for your investment journey:
| Broker | ETF Fees | Minimum deposit | Number of ETFs |
| eToro | $0 (other fees apply) | $50 (varies between countries) | 300+ |
| Interactive Brokers | Varies by exchange with tiered pricing: 0.05% of Trade Value (min: €1.25, max: €29.00) | €/$/£0 | 13,000+ |
| DEGIRO* | £/€0 (in some ETFs, + a €/£1 handling fee), plus an annual £/€2.50 connectivity fee | €/£1 | 200+ |
| XTB | $/€/£0 | €/$/£1 | 100+ |
| Lightyear | No Lightyear execution fees for ETFs, other fees may apply | €/$/£1 | 150+ |
*Disclaimer: Investing involves risk of loss.
Bottom line
Both VWCE and VUAA are strong options, but they answer different questions. VWCE offers broad global diversification across developed and emerging markets, at 0.14% a year. VUAA focuses exclusively on US large caps, at half the cost.
On a common period to 8 September 2026, VUAA is well ahead, at 194.23% against 137.90%, which makes it the stronger performer for anyone comfortable concentrating on the US market. Over the most recent 12 months VWCE was the better of the two, a useful reminder that the leadership of one market over another is not permanent.
Remember also that these are not independent choices. The US already makes up 61.6% of VWCE and eight of the ten largest holdings are common to both funds, so owning both mainly increases your US mega-cap weighting rather than broadening it.
Ultimately, the decision should align with your financial goals and risk tolerance.
If you need more guidance or have further questions, feel free to reach out to us.