What is the difference between VUAG and VUSA? These are two ETFs that, despite having different tickers, track the same index, the S&P 500. The difference lies in what happens to the dividends: VUSA distributes them, while VUAG accumulates them.
In fact, they are not two separate funds. They are two share classes of the same Vanguard fund, which holds the same portfolio for both. VUSA is the distributing share class, paying dividends quarterly. VUAG is the accumulating share class, reinvesting dividends inside the fund instead of paying them out.
Throughout this article, we cover all the relevant points so you can make an informed investment decision.
VUAG vs VUSA compared in a nutshell
Our team has compiled all the information discussed throughout the article into a table, so you can see the differences at a glance.
| ETF | VUAG | VUSA |
| ISIN | IE00BFMXXD54 | IE00B3XXRP09 |
| Index tracked | S&P 500 | S&P 500 |
| Fund manager | Vanguard | Vanguard |
| Inception date | 14 May 2019 | 22 May 2012 |
| Share class assets | $34,182 m | $51,854 m |
| ExchangesOn some exchanges the ticker differs. VUAG trades as VUAA on Borsa Italiana, Deutsche Börse and the London Stock Exchange in USD. | London Stock Exchange, Deutsche Börse, Borsa Italiana | London Stock Exchange, SIX Swiss Exchange, Euronext Amsterdam, Deutsche Börse, Borsa Italiana |
| Fund currencyThe fund currency is the reporting currency. You can still trade both share classes in currencies such as EUR, GBP and CHF. | USD | USD |
| Dividend distribution | Accumulating | Distributing (quarterly) |
| Ongoing charges (OCF) | 0.07% | 0.07% |
Source: Vanguard factsheets for both share classes, data as at 31 July 2026.
Performance
A common misunderstanding is that VUAG performs better than VUSA. It doesn’t. Both share classes hold the same portfolio and charge the same fee, so their total returns are the same.
Vanguard’s own factsheets show identical figures for both, net of expenses (31 July 2026):
| Period | VUAG and VUSA | Benchmark |
| Year to date | 9.99% | 9.92% |
| 1 year | 19.28% | 19.14% |
| 3 years (annualised) | 19.01% | 18.85% |
| 5 years (annualised) | 12.55% | 12.37% |
| 10 years (annualised) | 14.72% (VUSA only, VUAG has a shorter track record) | 14.50% |
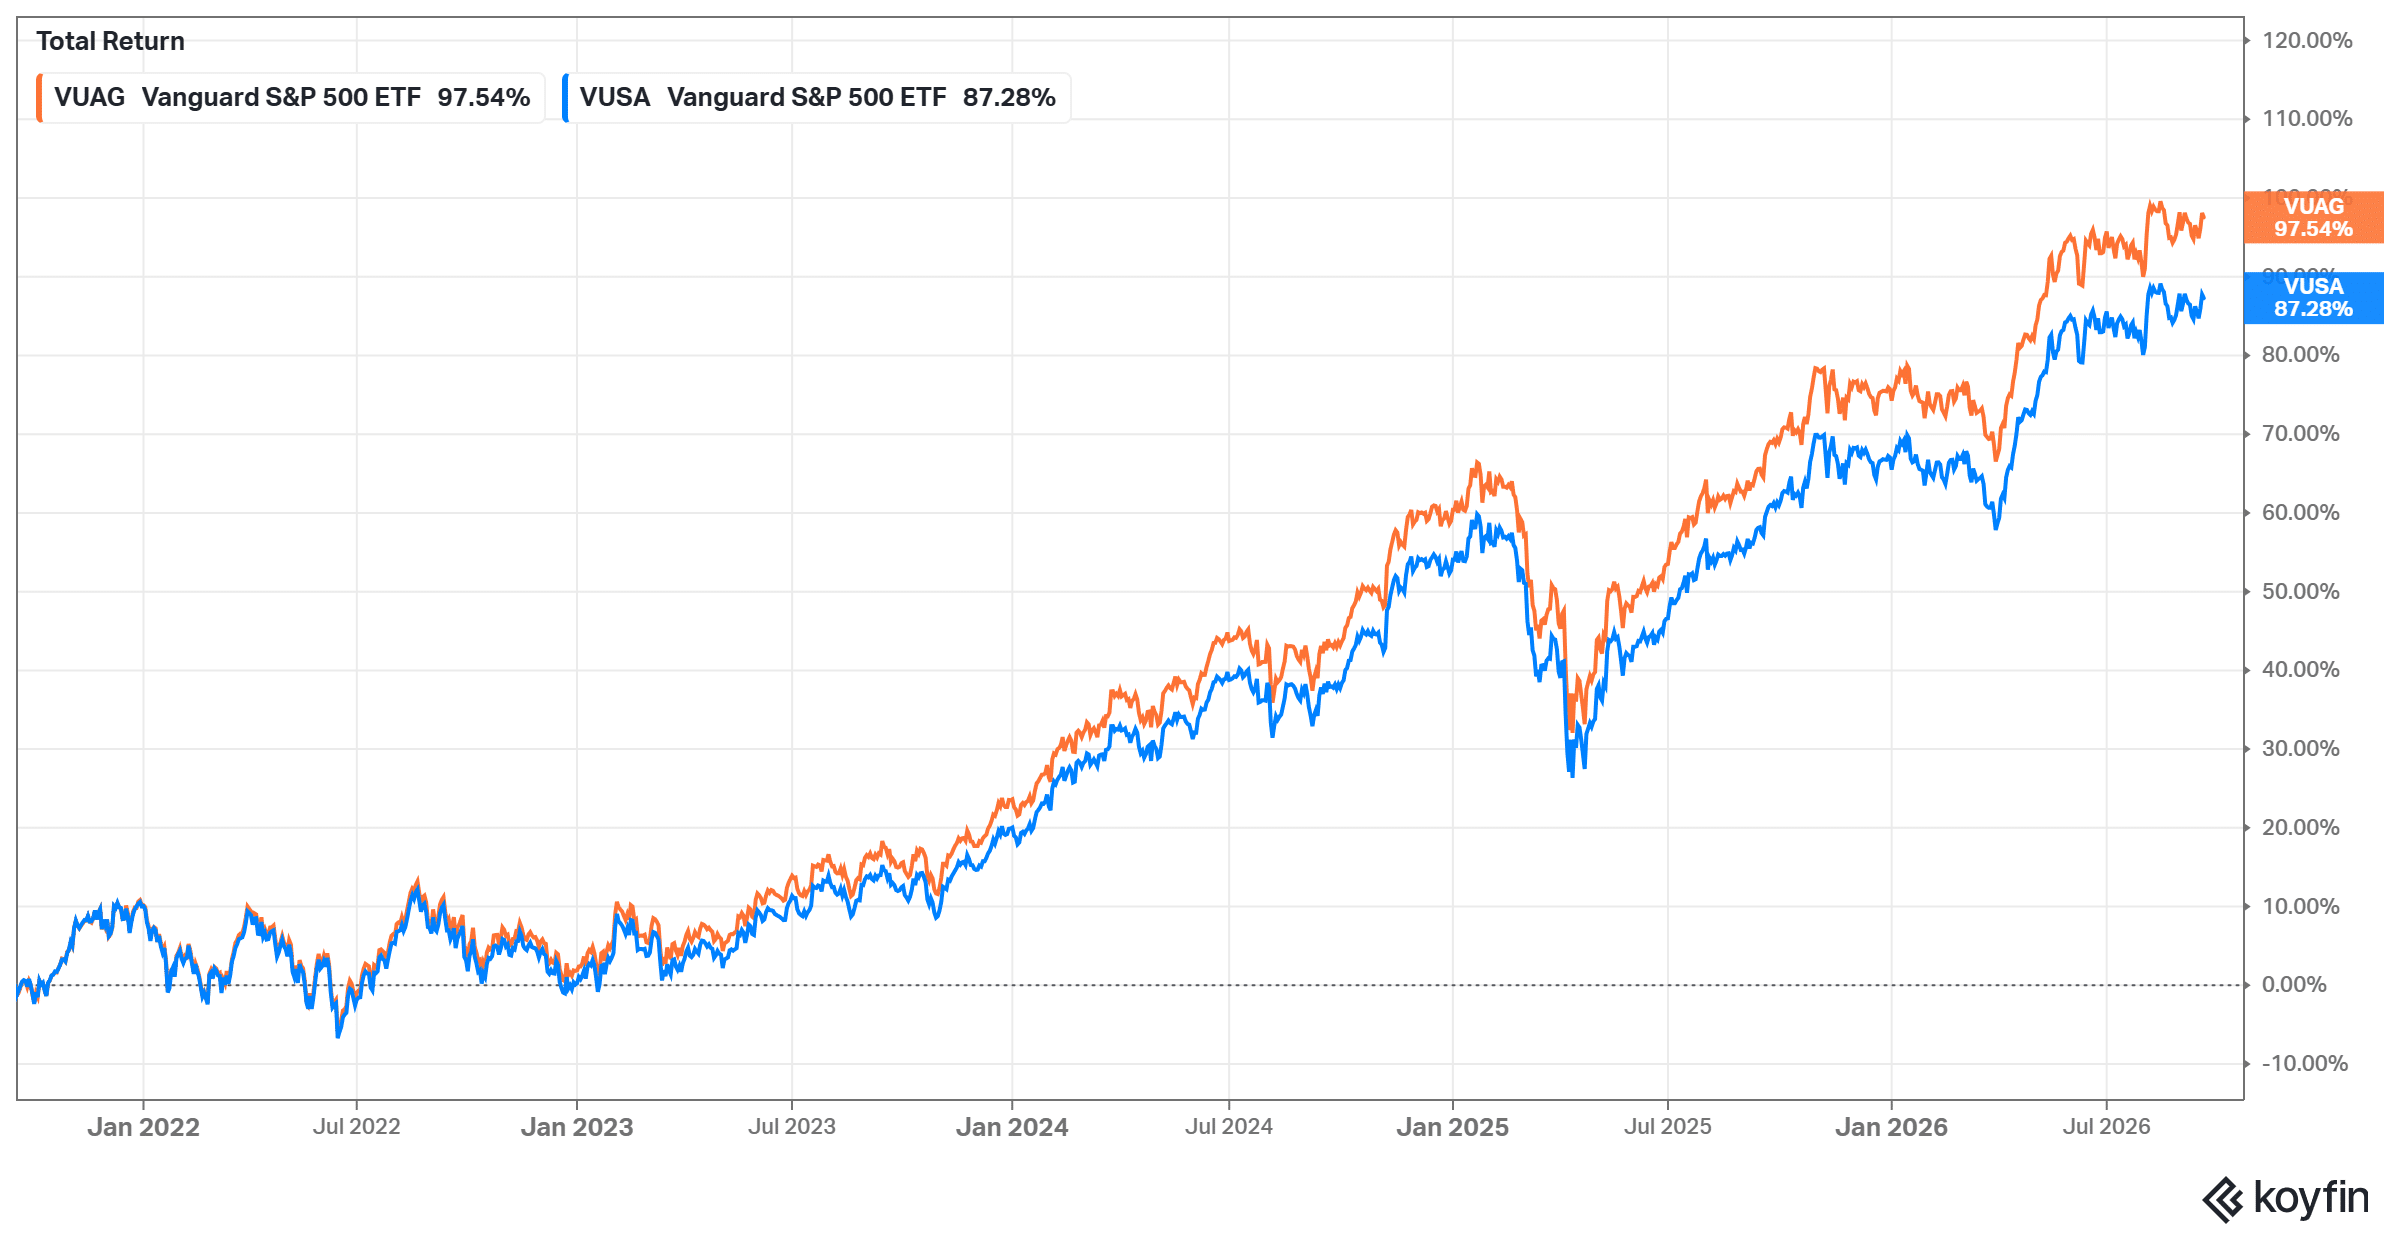
Where the two look different is on a price chart. VUAG’s share price rises faster because the dividends stay inside the fund, while VUSA’s price drops each time it pays a dividend out. If you add those dividends back, the two lines match.
The chart below shows this price-only effect, with VUSA in blue and VUAG in orange. It excludes the dividends VUSA paid, so it is not a like-for-like comparison of what an investor actually earned.
Index tracked
Both VUAG and VUSA track the S&P 500, an index of 500 large-cap companies in the United States. Since they are two share classes of the same fund, their holdings are identical by definition, not just similar.
The fund held 504 stocks as at 31 July 2026, and its benchmark is the S&P 500 Net Total Return index.
Both use physical replication. This means the fund manager buys the shares that make up the index, rather than using derivatives to track it.
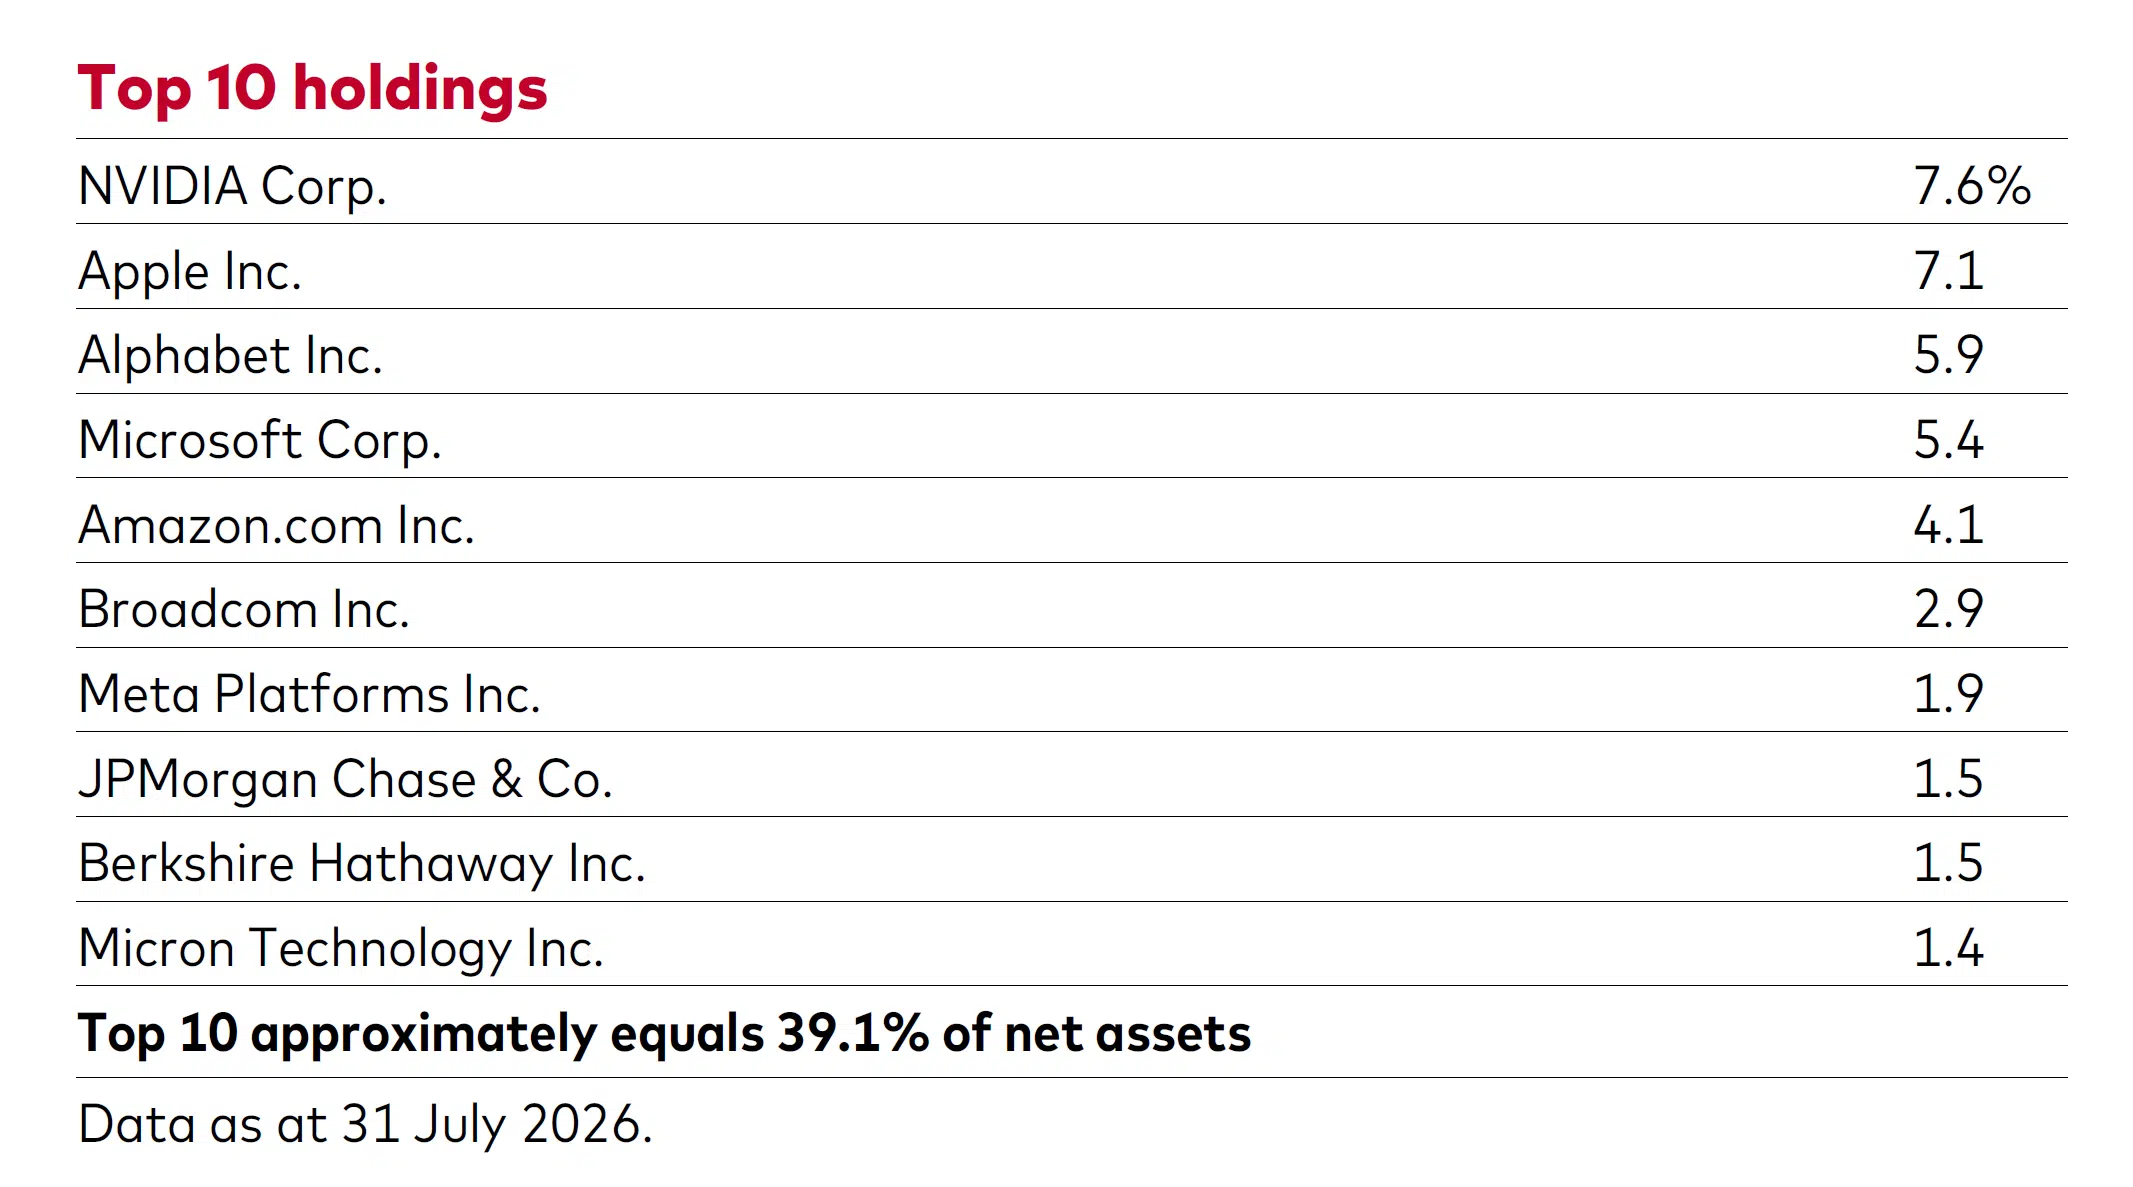
These were the fund’s ten largest holdings at 31 July 2026, together roughly 39.1% of the portfolio:
| Holding | Weight |
| NVIDIA | 7.6% |
| Apple | 7.1% |
| Alphabet | 5.9% |
| Microsoft | 5.4% |
| Amazon | 4.1% |
| Broadcom | 2.9% |
| Meta Platforms | 1.9% |
| JPMorgan Chase | 1.5% |
| Berkshire Hathaway | 1.5% |
| Micron Technology | 1.4% |
Source: Vanguard factsheets for both share classes, data as at 31 July 2026.
Fund manager
Both share classes belong to the same fund, managed by Vanguard through Vanguard Funds plc, authorised by the Central Bank of Ireland. VUSA launched in May 2012 and VUAG in May 2019.

Assets under management
The fund behind both tickers held $86,036 million at 31 July 2026. That total is split between the two share classes, and VUSA is the larger of the two, helped by its seven-year head start.
| ETF | VUAG | VUSA |
| Share class assets (millions) | $34,182 m | $51,854 m |
| Total fund assets (millions) | $86,036 m | |
Source: Vanguard factsheets for both share classes, data as at 31 July 2026.
Size matters less here than it might seem. Because both share classes draw on the same portfolio, neither is more or less diversified than the other, and both are large enough for liquidity not to be a concern.
Currency
Both VUAG and VUSA have the US dollar (USD) as their fund currency. However, the tickers can be traded in different currencies depending on the exchange, as with the GBP listings on the London Stock Exchange.
Both are unhedged, meaning they don’t use currency hedging strategies. You are therefore exposed to currency risk: movements between the dollar and your own currency affect your returns, whichever share class you buy.
Note that the trading currency doesn’t change your underlying exposure. Buying VUSA in euros on Borsa Italiana still gives you exposure to US companies earning in dollars.
Exchanges
These ETFs trade on several exchanges and in several currencies, which is why the ticker changes from one place to another. The table below lists the main listings for each share class:
| Listing | Trade currency | VUAG | VUSA |
| London Stock Exchange | GBP | VUAG | VUSA |
| London Stock Exchange | USD | VUAA | VUSD |
| Deutsche Börse (XETRA) | EUR | VUAA | VUSA |
| Borsa Italiana | EUR | VUAA | VUSA |
| Euronext Amsterdam | EUR | – | VUSA |
| SIX Swiss Exchange | CHF | – | VUSA |
Main listings shown on the Vanguard factsheets (31 July 2026). Both share classes are also available through other venues and brokers, sometimes under the same tickers.
Distribution
This is the only real difference between the two. VUAG is the accumulating share class, reinvesting dividends inside the fund instead of paying them out. This may suit you if you are investing for the long term and don’t need income, since you avoid having to reinvest the dividends yourself and pay a commission each time.
VUSA is the distributing share class, paying dividends quarterly. This can appeal if you want regular income from your investments, or if accumulating funds are treated unfavourably where you live.
The underlying holdings yielded around 1.1% in dividends at 31 July 2026. That gives you a rough idea of the cash VUSA pays out and the amount VUAG reinvests, although the fund’s own distribution yield differs slightly.
Tax strategy
The tax treatment is where your choice usually matters most, and it depends entirely on where you live.
With VUSA, dividends are taxed in the year you receive them. With VUAG, there is no cash payment, so in many countries nothing is taxed until you sell. That deferral is the main appeal of accumulating funds: your money compounds on the full amount rather than on the amount left after tax.
However, this isn’t universal:
- Germany applies the Vorabpauschale, an annual advance lump-sum tax on accumulating funds, so the deferral is partial.
- Ireland taxes ETFs at 38% under its exit tax regime, with a deemed disposal every eight years whether or not you sell.
- Other countries treat both types the same, or tax dividends more lightly than capital gains, which can favour the distributing class.
Both share classes report for tax purposes in Austria, Germany, Switzerland and the UK, which matters in countries where non-reporting funds are taxed more heavily.
Check your own country’s rules, or speak to an accountant, before choosing between the two.
Fund domicile
Both VUAG and VUSA are domiciled in Ireland, since they are share classes of the same Irish-domiciled fund. Irish-domiciled ETFs benefit from a lower withholding tax on US dividends than most alternatives.
| ETF | VUAG | VUSA |
| US dividend withholding tax | 15% | 15% |
Thanks to the tax treaty between Ireland and the United States, the fund pays 15% withholding tax on dividends from US stocks instead of the standard 30%. This applies equally to both share classes, so it is not a reason to pick one over the other.
Irish domicile also means neither is subject to US estate tax, which can apply to US-domiciled ETFs held by non-US investors.
Ongoing charges
Besides what you pay your broker when trading, there is a running cost charged by the fund manager. Vanguard reports it as the ongoing charges figure (OCF), which covers administration, audit, depository, legal, registration and regulatory expenses. It is the same for both share classes, at 0.07%.
| ETF | VUAG | VUSA |
| OCF | 0.07% | 0.07% |
The charge is taken daily from the fund’s net asset value, so you never see it as a separate payment. On €10,000 invested, 0.07% works out at around €7 a year.
Since the fee is identical, your total cost comes down to your broker: commission, currency conversion and any custody fee.
Diversification
Both share classes hold the same portfolio, so their diversification is identical. As S&P 500 trackers, they focus on the US stock market: the fund’s market allocation is 100% United States.
That means limited direct exposure to companies outside the US. In practice, most of these companies sell worldwide, so your economic exposure is broader than the allocation suggests. You can explore this in our article “Stocks: What is Your Real Country/Currency Exposure?“.
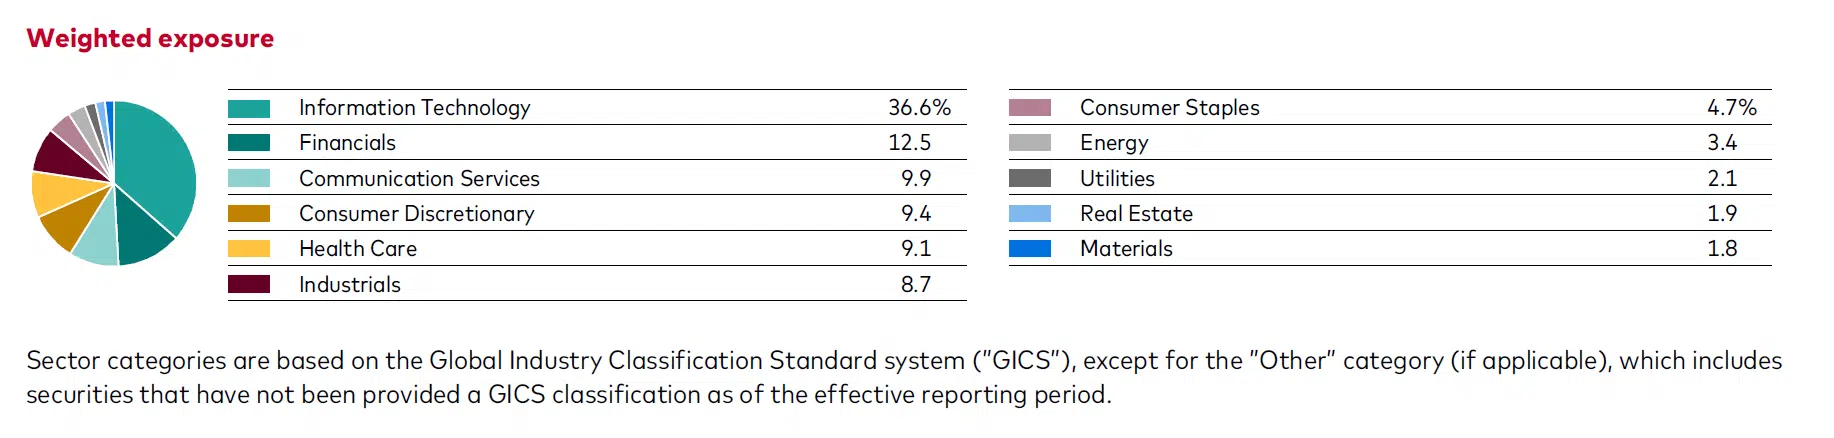
By sector, the fund is spread across the economy, although technology dominates (31 July 2026):
| Sector | Weight |
| Information Technology | 36.6% |
| Financials | 12.5% |
| Communication Services | 9.9% |
| Consumer Discretionary | 9.4% |
| Health Care | 9.1% |
| Industrials | 8.7% |
| Consumer Staples | 4.7% |
| Energy | 3.4% |
| Utilities | 2.1% |
| Real Estate | 1.9% |
| Materials | 1.8% |
Worth knowing: the ten largest holdings make up about 39.1% of the fund. You own 504 companies, but a handful of them drive much of the performance.
Cheapest brokers to invest in VUAG and VUSA
Now that we’ve covered the differences between the two, it’s worth looking at where to buy them. Since the fund charges the same fee either way, your broker is what decides your total cost.
Here are four options and what each is good for:
- Interactive Brokers: best for the largest ETF offering
- Freetrade: best for beginners
- Trading 212: best for commission-free stock and ETF trading (other fees may apply, see terms and fees)
- InvestEngine: best for expert-managed portfolios
Disclaimer: When investing, your capital is at risk and you may get back less than invested. Past performance doesn’t guarantee future results.
| Broker | ETF fees | Minimum deposit | Number of ETFs | Regulators | Country |
| Interactive Brokers | Up to $0.0035 per share (min. $0.35) for international investors | €/$/£0 | 13,000+ | SEC, FINRA, CFTC, CIRO, FCA, CBI, ASIC, SFC, SEBI, MAS, MNB | Available worldwide (exceptions apply) |
| Freetrade | £0 commission (other charges may apply) | £0 | 1,100+ | FCA | Available in the UK |
| Trading 212 | €/£0 commission (other fees may apply) | €/£0 | 600+ | FCA, CySEC, BaFin, ASIC | Available worldwide (exceptions apply, not the US) |
| InvestEngine | 0% on DIY portfolios, 0.25% on managed portfolios | £100 | 700+ | FCA | Available in the UK only |
Do all these brokers offer both VUAG and VUSA?
| Broker | VUAG | VUSA |
| Interactive Brokers | ✔ | ✔ |
| Freetrade | ✔ | ✔ |
| Trading 212 | ✔ | ✔ |
| InvestEngine | ✔ | ✔ |
Broker fees checked in September 2026. Availability of each listing may vary by country and account type.
Conclusion
VUAG and VUSA are two share classes of the same Irish-domiciled Vanguard fund, tracking the S&P 500. They hold the same stocks, charge the same 0.07% and deliver the same total return.
The only difference is what happens to the dividends. VUSA pays them out quarterly, so it suits you if you want income, or if accumulating funds are taxed unfavourably where you live. VUAG reinvests them inside the fund, which saves you the work and the commission of reinvesting, and in many countries defers tax until you sell.
Neither is “better performing”. Price charts that appear to show VUAG ahead simply leave out the dividends VUSA paid.
So the decision comes down to two questions: do you want the income now, and how does your country tax each type? Once you’ve answered those, your broker’s fees are what’s left to compare.
Risk disclaimer: When investing, your capital is at risk and you may get back less than invested. Past performance doesn’t guarantee future results. This article is for information only and is not investment or tax advice.