Indexes such as the S&P 500 and MSCI World track the performance of a specific group of stocks or financial assets. They essentially serve as benchmarks to gauge the performance of broad markets or specific sectors.
Both are widely used as long-term investing vehicles given their large-cap equity exposure, but which one is better suited to your portfolio? And are they even comparable in the first place?
In this article, we’ll explore the differences between the S&P 500 and the MSCI World so you can make a better-informed decision about which index to invest in. We’ll cover performance, country and sector exposure, concentration risk, currency considerations, the availability of ETFs, and more.
S&P 500 vs MSCI World (summary)
- S&P 500: 503 US large-cap stocks, ~100% US exposure, top 10 holdings now represent 35-40% of the index (driven by mega-cap tech and the AI rally). The lowest available TER for European investors is around 0.03-0.07%;
- MSCI World: ~1,300 stocks across 23 developed markets, but still ~72% US-weighted due to market-cap methodology. Despite the “World” name, exposure to non-US markets is more modest than many investors expect. TERs typically range 0.12-0.20%;
- Performance: the S&P 500 has outperformed the MSCI World over the past decade, driven primarily by US tech outperformance – though past performance does not guarantee future returns;
- Overlap: roughly 70-72% of the MSCI World already consists of US stocks – which means owning both provides limited additional diversification;
- Currency exposure: both indices are predominantly USD-exposed – meaningful for EUR/GBP investors who bear FX risk on top of equity risk;
- Concentration risk: the S&P 500’s top 10 holdings now account for more than a third of the entire index – higher than at any prior point in the past 25 years;
- The right choice depends on: your view on continued US outperformance, your appetite for concentration in mega-cap tech, and whether you actively want exposure to Japan, Europe, and other developed markets beyond the US.
Below, we’ll break down each of these dimensions in detail – including country and sector exposure, top holdings, available ETFs for European investors, and which broker to use to buy them.
MSCI World vs S&P 500 compared in a nutshell
Our team has compiled all the information discussed throughout the article into a table, so that it can be easier for you to observe the differences and make a decision.
| Index | MSCI World | S&P 500 |
| Number of holdings | ~1,308 | 503 |
| Countries covered | 23 developed markets | United States only |
| Top 5 countries | US (72.45%), Japan (5.71%), UK (3.50%), Canada (3.38%), France (2.39%) | United States (100%) |
| US weighting | ~72% | 100% |
| Top 5 sectors | Information Technology, Financials, Industrials, Consumer Discretionary, Health Care | Information Technology, Financials, Communication Services, Consumer Discretionary, Health Care |
| Top 10 concentration | ~28% of index weight | ~35-40% of index weight |
| Currency exposure | ~72% USD; rest spread across JPY, GBP, EUR, CAD, CHF | 100% USD-denominated |
| Typical TER range (UCITS ETFs) | 0.12-0.20% | 0.03-0.07% |
| Availability of ETFs | Moderate (mainly listed on XETRA, Borsa Italiana, Euronext Amsterdam) | Extensive (listed across nearly all major European exchanges) |
Data as of May 2026. Index weights are subject to change with market movements and quarterly rebalancing.
What are the S&P 500 and the MSCI World indices?
The Standard & Poor’s 500, known as the S&P 500, is one of the primary equity benchmarks in the United States. It comprises 503 large-cap US companies listed on US stock exchanges, representing various sectors of the economy (Information Technology, Health Care, Financials, and so on). Because many of its constituent companies generate significant international revenues, it also provides indirect exposure to global growth – though the stocks themselves are exclusively US-listed and USD-denominated.
The MSCI World Index tracks the performance of large and mid-cap stocks across 23 developed markets worldwide, covering around 85% of the free-float market capitalisation in each country. The current developed-market constituents include the US, Canada, Japan, Australia, New Zealand, Singapore, Hong Kong, Israel, and the developed economies of Western Europe. Notably, the MSCI World does not include emerging markets like China, India, or Brazil – for that exposure, you’d need the MSCI ACWI (which adds emerging markets to MSCI World) or a dedicated MSCI Emerging Markets ETF.
Both indices use float-adjusted market-capitalisation weighting, meaning larger companies have proportionally larger weights, and only freely tradable shares (excluding insider and government holdings) are counted. This methodology is industry standard but has the side effect of concentrating exposure in the largest companies – a topic we’ll cover in more detail below.
Performance
When comparing the historical performance of both indices, the S&P 500 has outperformed the MSCI World Index over the past decade – driven primarily by the strong relative performance of US large-cap technology stocks. However, this outperformance is not guaranteed to continue, and there have been multi-year periods (notably 2000-2009) where the MSCI World outperformed the S&P 500.
To illustrate the relative performance of each index, we’ve used two of the most popular UCITS ETFs that track them: the iShares Core S&P 500 UCITS ETF (CSPX) and the iShares Core MSCI World UCITS ETF (IWDA). Both are Irish-domiciled accumulating ETFs available to European investors, which makes them directly comparable.
The chart below shows the performance of both ETFs since 2016. In orange, you can see the evolution of CSPX (S&P 500); in blue, the trend of IWDA (MSCI World). Both ETFs reinvest dividends, so the comparison reflects total return performance.
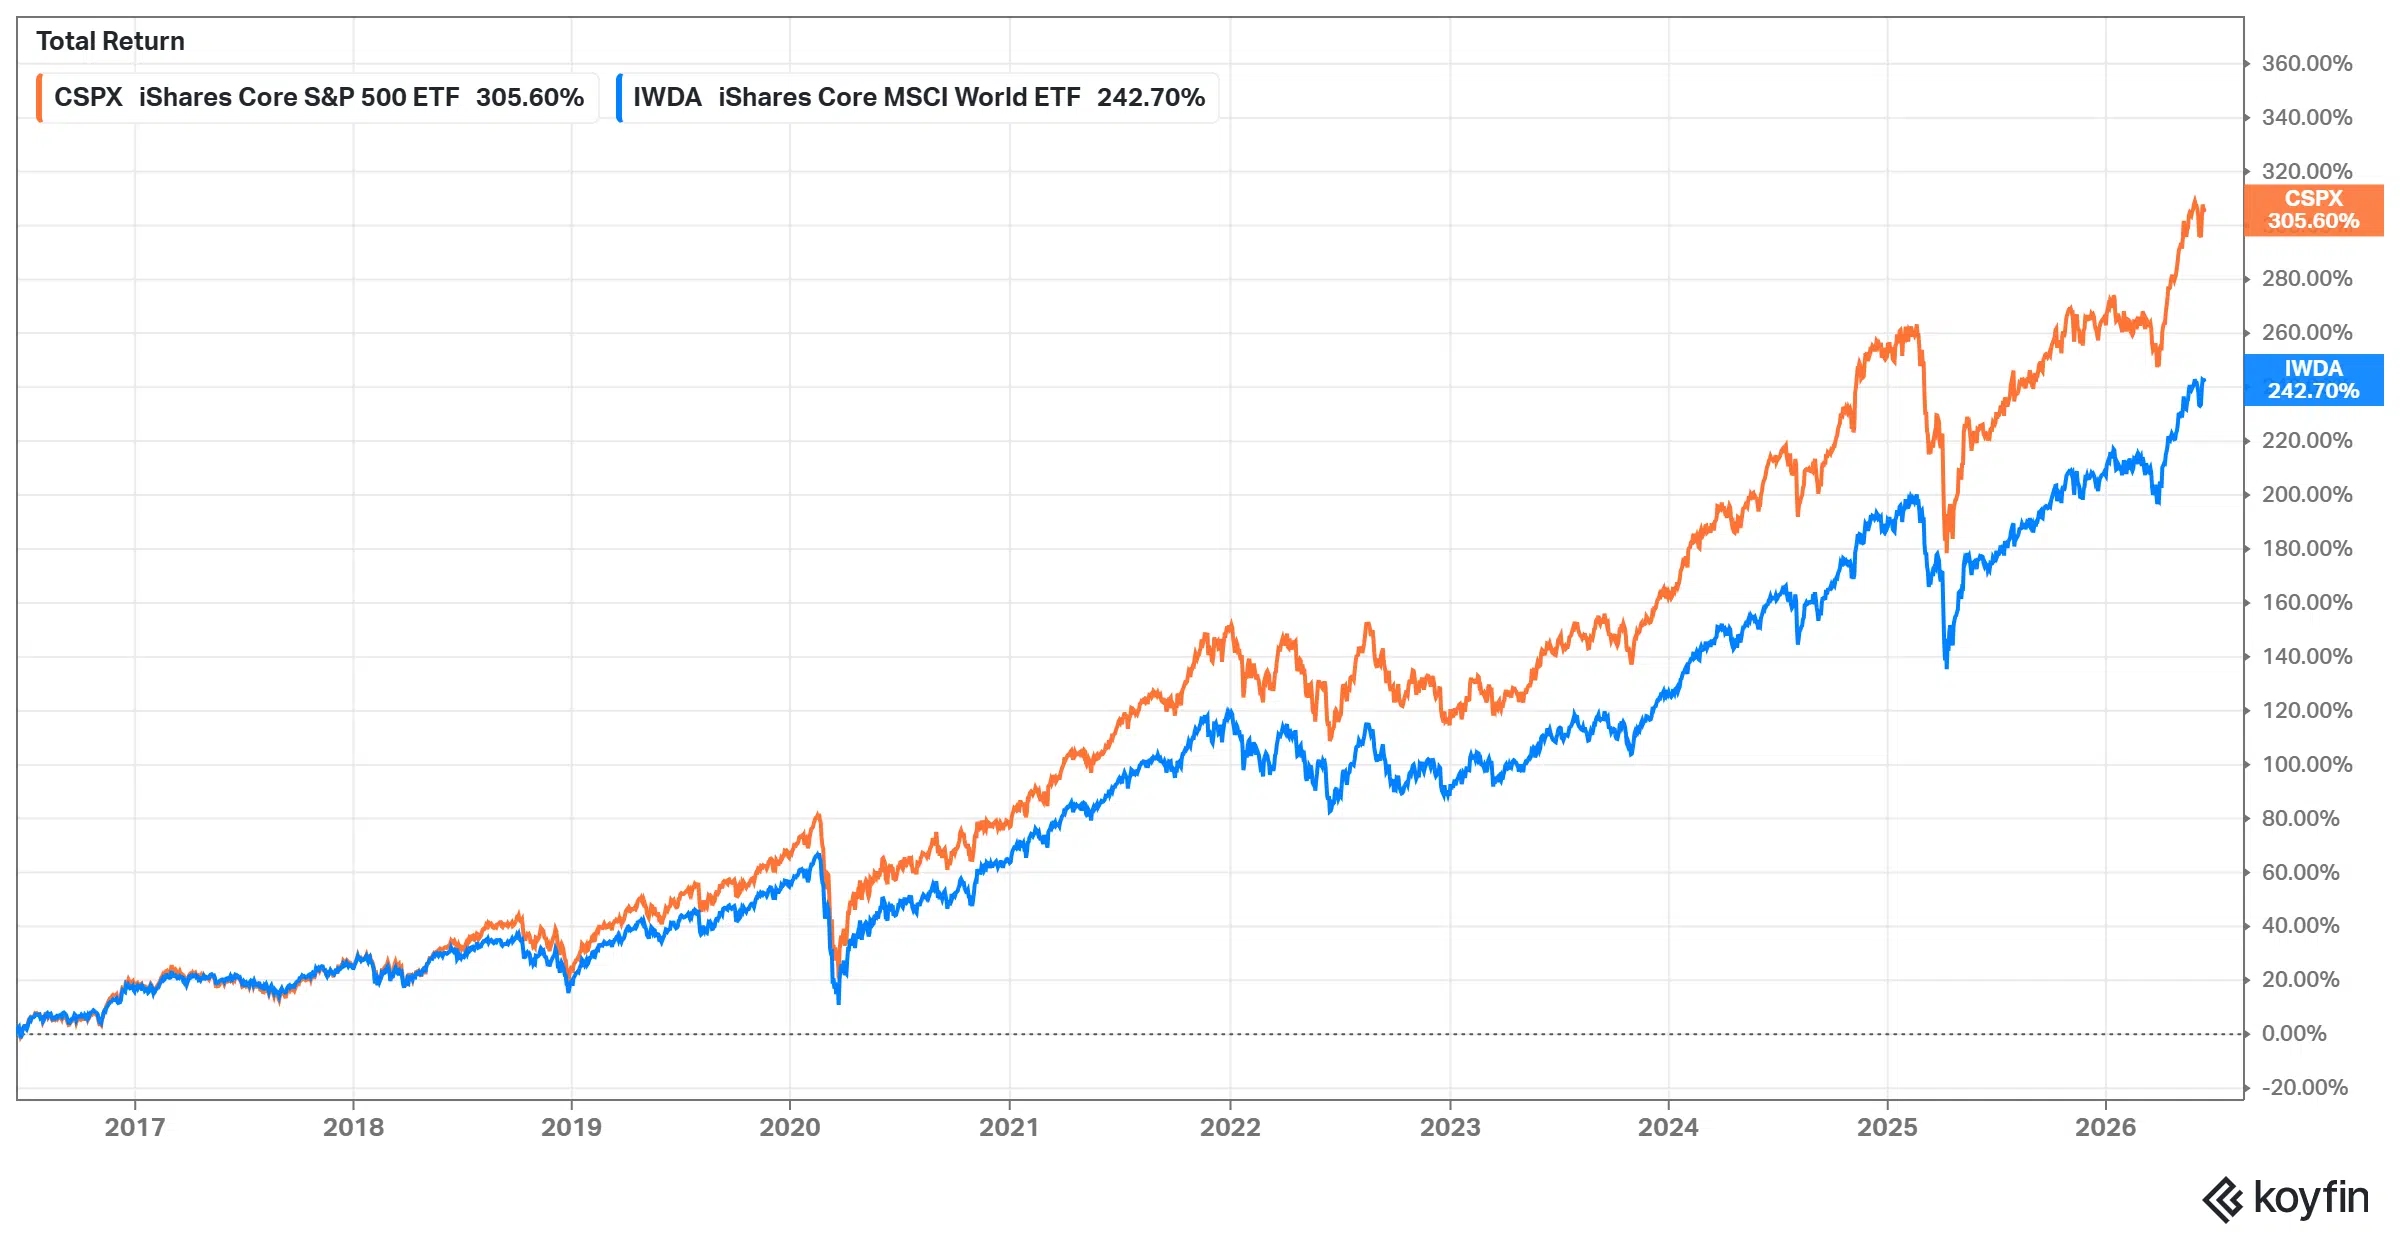
Nevertheless, it is crucial to recognize that past performance is not indicative of future returns, and these results may not persist indefinitely.
Country diversification
The MSCI World Index includes large and mid-cap stocks from 23 developed countries, with constituents listed across multiple stock exchanges in North America, Europe, Asia-Pacific, and Israel. Country weights are determined by float-adjusted market capitalisation, which is why the US dominates – American companies represent the largest share of global developed-market equity value.
| Country | Weight |
| United States | 72.45% |
| Japan | 5.71% |
| United Kingdom | 3.50% |
| Canada | 3.38% |
| France | 2.39% |
| Others (18 markets) | 12.57% |
Note: Weights as of May 29, 2026, per the official MSCI World Index factsheet. Country weights fluctuate with market movements and quarterly rebalancing.
The “Others” category includes the remaining 18 developed-market countries tracked by MSCI World, such as Switzerland, Germany, the Netherlands, Australia, Italy, Spain, Sweden, Denmark, Hong Kong, Singapore, and others. Despite the “World” branding, it’s worth noting that nearly three-quarters of the MSCI World is allocated to a single country (the US) – which has important implications for investors seeking genuine geographic diversification.
On the contrary, the S&P 500 exclusively focuses on large-cap US equities listed on US exchanges.
Given that, do you think a US-based company listed in the NASDAQ or NYSE has 100% US-country risk?
Around 40% of the revenues of the S&P 500 companies came from countries outside of the USA, which means that assessing the company’s country revenues (and, consequently, currency exposure) will help you better understand the actual country risks of the business, more about it in our article about understanding your country/currency exposure.
Sector diversification
Both indices share a similar sector structure, with Information Technology dominating in both cases – reflecting the rise of US mega-cap tech that anchors both indices. However, there are some meaningful differences: the S&P 500 has a significantly higher weighting to Information Technology (around 8 percentage points more), while the MSCI World has greater exposure to Financials and Industrials due to its broader geographic spread into European and Japanese markets where those sectors carry more weight.
| Sector (weights) | MSCI World | S&P 500 |
| Information Technology | 30.66% | 38.48% |
| Financials | 15.33% | 11.27% |
| Industrials | 11.25% | 8.28% |
| Consumer Discretionary | 9.20% | 9.71% |
| Communication Services | 8.66% | 10.37% |
| Health Care | 8.55% | 8.29% |
| Consumer Staples | 4.97% | 4.53% |
| Energy | 3.78% | 3.13% |
| Materials | 3.40% | 1.83% |
| Utilities | 2.48% | 2.10% |
| Real Estate | 1.71% | 2.01%* |
*S&P 500 Real Estate figure reflects the “Other” category in the iShares Core S&P 500 UCITS ETF fact sheet, which primarily comprises Real Estate holdings. Weights as of May 2026, per the official MSCI World Index factsheet and iShares Core S&P 500 UCITS ETF fact sheet. Sector allocations fluctuate with market movements and quarterly rebalancing.
A few observations worth noting:
- Information Technology dominates both indices – but the S&P 500’s IT weighting of ~38% is materially higher than the MSCI World’s ~31%, reflecting the US’s concentration in mega-cap tech companies (Nvidia, Apple, Microsoft, Broadcom);
- If you include tech-adjacent sectors (Communication Services – which contains Alphabet and Meta – and Consumer Discretionary – which contains Amazon and Tesla), the S&P 500’s total exposure to “broadly tech” stocks exceeds 55%;
- The MSCI World has greater exposure to Financials and Industrials: these sectors are more prominent in European and Japanese markets, which contribute meaningfully to the MSCI World but not at all to the S&P 500;
- Energy and Materials are notably small in both indices – reflecting the decline of commodity-heavy sectors in developed-market equity composition over the past decade.
Number of holdings
The MSCI World Index has a broader constituent base with 1,308 stocks across 23 developed markets, while the S&P 500 has 504 holdings spanning a single market (the US). It may seem odd that the S&P 500 doesn’t have exactly 500 stocks, but the explanation is simple: several companies in the index have multiple share classes that are each counted separately. The most prominent example is Alphabet (Google’s parent), which has both Class A shares (voting, ticker GOOGL) and Class C shares (non-voting, ticker GOOG) included in the index. Berkshire Hathaway and a handful of other dual-class companies contribute the remaining additional holdings.
While the MSCI World’s 2.5x larger constituent count suggests significantly more diversification, in practice the diversification benefit is more modest than the raw numbers suggest. Both indices use float-adjusted market-capitalisation weighting, which means the largest companies dominate regardless of how many smaller stocks are also held. As we’ll see in the top 10 holdings comparison below, the same handful of US mega-cap stocks anchor both indices.
Top 10 holdings
The top 10 holdings of both indices reveal one of the most striking aspects of modern equity investing: both indices share the exact same top 10 constituents, all US-listed mega-cap technology companies. The only difference is the absolute weighting – each stock represents a larger share of the S&P 500 (which has only 504 holdings) than of the MSCI World (which spreads its weight across 1,308 holdings).
| S&P 500 | MSCI World | ||
| Stocks | Weights | Stocks | Weights |
| Nvidia Corp | 7.88% | Nvidia Corp | 5.64% |
| Apple Inc | 7.04% | Apple Inc | 5.05% |
| Microsoft Corp | 5.14% | Microsoft Corp | 3.50% |
| Amazon.com Inc | 4.06% | Amazon.com Inc | 2.86% |
| Alphabet Inc Class A | 3.40% | Alphabet Inc Class A | 2.44% |
| Broadcom Inc | 3.25% | Broadcom Inc | 2.21% |
| Alphabet Inc Class C | 2.70% | Alphabet Inc Class C | 2.02% |
| Meta Platforms Inc Class A | 2.13% | Meta Platforms Inc Class A | 1.52% |
| Tesla Inc | 1.88% | Tesla Inc | 1.36% |
| Micron Technology Inc | 1.68% | Micron Technology Inc | 1.20% |
| Top 10 total | 39.16% | Top 10 total | 27.80% |
Data sources: iShares Core S&P 500 UCITS ETF (CSPX) fact sheet as of May 31, 2026, and MSCI World Index factsheet as of May 29, 2026. Top 10 holdings are subject to change with market movements and quarterly index rebalancing.
A few observations from this comparison:
- Identical constituents: both indices share the exact same top 10 – all US-based technology, communication services, and consumer discretionary mega-caps. Notably, no non-US company appears in the MSCI World’s top 10 despite the “World” name;
- Concentration multiplier: the S&P 500’s top 10 weight (~39%) is roughly 1.4x the MSCI World’s top 10 weight (~28%) – but both are historically elevated. In 2015, the S&P 500’s top 10 represented only ~19% of the index;
- The “Magnificent 7” footprint: combining Nvidia, Apple, Microsoft, Amazon, Alphabet (both classes), Meta, and Tesla, this group alone represents ~34% of the S&P 500 and ~25% of the MSCI World – meaning even the “globally diversified” MSCI World has a quarter of its weight in just seven US tech stocks;
- What this means for diversification: investors who hold both an S&P 500 ETF and an MSCI World ETF are essentially doubling their exposure to the same handful of mega-cap stocks – the diversification benefit of owning both is minimal.
Concentration risk in the S&P 500
One of the most important developments in equity investing over the past decade has been the rising concentration of the S&P 500 in a handful of mega-cap technology stocks. This deserves particular attention because it materially changes the risk profile of what most investors assume is a broadly diversified index.
The concentration data
- The S&P 500’s top 10 holdings now represent approximately 35-40% of the entire index (depending on the measurement date), up from around 19% in 2015 and 23% at the dot-com peak in 2000;
- The “Magnificent 7” (Nvidia, Apple, Microsoft, Amazon, Alphabet, Meta, Tesla) alone represent close to 30% of the S&P 500;
- Information Technology as a sector now accounts for over 34% of the index – and that’s before counting the tech-adjacent companies classified under Communication Services (Alphabet, Meta) and Consumer Discretionary (Amazon, Tesla);
- The MSCI World partially mitigates this through geographic diversification, but its top 10 holdings still represent ~28% of the index – because those same US mega-caps dominate global market cap.
Why this matters
Concentration creates three concrete risks for investors who believe they’re broadly diversified:
- Idiosyncratic shock risk: a single earnings miss or regulatory event at one of the top 10 names can materially move the entire index. When Nvidia alone represents nearly 7-8% of the S&P 500, the index’s fate is significantly tied to one company’s execution;
- The passive concentration trap: when you buy an S&P 500 ETF, more than $35-40 of every $100 invested flows directly into just 10 companies. This is a far cry from the diversification that index investing is typically marketed as providing;
- AI correlation risk: the top holdings are no longer spread across unrelated industries (as they were in 1990, when IBM, Exxon, GE, and Philip Morris were all in the top 10). Today’s leaders are closely linked by a common theme – artificial intelligence and the underlying infrastructure for it – meaning a sentiment shift on AI could simultaneously affect multiple top holdings.
How does the MSCI World compare?
The MSCI World’s diversification advantage is genuine but more modest than the “1,300+ stocks” headline suggests. Because of market-cap weighting, the same US mega-caps that dominate the S&P 500 are also the largest holdings in the MSCI World. The MSCI World’s top 10 still consists almost entirely of US stocks – just at slightly lower weights because the rest of the world gets some share.
For investors specifically concerned about concentration risk, alternatives include:
- Equal-weight ETFs: the iShares S&P 500 Equal Weight UCITS ETF (XDEW) or Invesco S&P 500 Equal Weight UCITS ETF (SPEX) – each holding gets a 0.2% weight regardless of market cap;
- MSCI World ex USA: explicitly excludes US stocks for those wanting pure non-US developed market exposure;
- MSCI ACWI: adds emerging markets to MSCI World for broader global exposure;
- Factor ETFs: value, quality, or small-cap-tilted ETFs that deliberately weight away from mega-cap growth.
None of this is to suggest the S&P 500 is a bad investment – it has delivered exceptional returns over the past decade precisely because of the concentration in winners. But investors should make this choice consciously rather than assuming they’re getting broad diversification when they’re actually getting concentrated exposure to US mega-cap technology.
Currency exposure and risk
For European investors (the primary audience for UCITS ETFs), currency exposure is one of the most overlooked aspects of investing in these indices. Both the S&P 500 and MSCI World are dominated by USD-denominated assets, which means EUR/GBP investors bear currency risk on top of equity risk.
What’s the actual currency exposure?
- S&P 500: ~100% USD-denominated. Even though many constituent companies earn significant international revenues, the stocks themselves are quoted and settled in USD;
- MSCI World: ~72% USD-denominated, ~6% JPY, ~4% GBP, ~3% CAD, and the remainder distributed across EUR, CHF, AUD, and other developed-market currencies.
This means that for a European investor holding the iShares Core S&P 500 UCITS ETF (CSPX) in EUR, your return in EUR is the underlying S&P 500 return plus or minus the USD/EUR exchange rate movement over your holding period. A 10% S&P 500 gain combined with a 5% USD depreciation against the EUR delivers only ~5% in EUR terms.
Currency-hedged ETF options
For investors who want to neutralise this currency risk, several currency-hedged ETF versions exist:
- iShares Core S&P 500 EUR Hedged UCITS ETF (IUSE): TER 0.10%;
- iShares MSCI World EUR Hedged UCITS ETF (IBCH): TER 0.55%;
- Xtrackers S&P 500 EUR Hedged UCITS ETF (D5BG): TER 0.20%.
Should you hedge currency exposure?
The trade-off isn’t straightforward:
- Hedged ETFs have higher TERs: typically 0.05-0.40% more expensive than their unhedged equivalents;
- Hedging costs eat into returns: there’s a structural “carry” cost (or benefit) baked into hedging, which depends on the interest rate differential between currencies;
- Over long horizons, currencies tend to mean-revert: academic research generally suggests that currency hedging doesn’t materially improve long-term equity returns – it primarily smooths short-term volatility;
- For shorter holding periods (under 5 years) or for retirees relying on EUR income, hedging may provide meaningful peace of mind by removing one source of volatility.
For most long-term European investors, the consensus among financial planners is to accept the USD exposure as part of investing in global equities, since the US companies in these indices earn revenues worldwide and the currency exposure provides a natural hedge against EUR-area economic weakness. But the decision deserves conscious consideration rather than ignoring it entirely.
Which index should you choose?
There’s no objectively “better” index – the right choice depends on your investment horizon, your view on future US outperformance, and your tolerance for concentration risk. Here’s an honest breakdown:
Choose the S&P 500 if
- You believe US large-cap stocks will continue to outperform global equities over your investment horizon;
- You want maximum cost efficiency: the cheapest S&P 500 ETFs have TERs as low as 0.03-0.07%, the lowest available for any major equity index;
- You’re comfortable with concentration in US mega-cap technology: you understand that you’re effectively making a concentrated bet on the continued dominance of a small group of companies;
- You have other portfolio allocations that provide diversification: e.g., dedicated European, emerging markets, or factor-based ETF holdings that compensate for the S&P 500’s US-centric concentration;
- You’re investing through a US-domiciled account: US investors typically prefer SPY, VOO, or IVV over UCITS alternatives due to tax efficiency.
Choose the MSCI World if
- You want a single ETF for global developed-market exposure: convenient one-fund solution with built-in geographic diversification;
- You’re concerned about US concentration but still want significant US exposure: the MSCI World’s 72% US weighting is high but not the 100% of the S&P 500;
- You actively want exposure to Japan, the UK, Canada, Europe, and other developed markets: the MSCI World provides this without requiring you to buy separate regional ETFs;
- You’re investing for the very long term: over 20-30 year horizons, the relative performance of different developed markets can shift meaningfully, and the MSCI World captures whichever wins;
- You prefer not to make active country bets: the MSCI World’s rules-based methodology means you’re not betting on any particular country outperforming.
Consider alternatives if
- You want truly global exposure including emerging markets: MSCI ACWI (e.g., via SSAC) or FTSE All-World (e.g., via VWRA) include both developed and emerging market stocks – more genuinely “global” than MSCI World;
- You’re concerned about mega-cap concentration: equal-weighted S&P 500 ETFs (XDEW, SPEX) or factor-tilted ETFs offer alternative weighting approaches;
- You want to deliberately reduce US exposure: MSCI World ex USA or dedicated MSCI Europe / MSCI Japan ETFs let you balance US-heavy holdings.
The “own both” question
Some investors hold both S&P 500 and MSCI World ETFs simultaneously, often without realising they’re essentially doubling down on the same US mega-cap exposure. Given that ~72% of the MSCI World is already US stocks (and largely the same companies as the S&P 500 top holdings), owning both provides limited diversification benefit and complicates portfolio management.
If you want truly diversified equity exposure, a more sensible combination is typically: MSCI World (or ACWI) for core developed-market exposure + a dedicated emerging markets ETF (e.g., MSCI EM) + potentially a small-cap or factor tilt – rather than overlapping mega-cap exposure through two near-identical large-cap indices.
Availability of ETFs
As you may already know, you cannot directly purchase an index. You need to buy a fund that tracks that index. Two types of funds that can track an index include exchange-traded funds (ETFs) and index funds.
S&P 500
The S&P 500 is such a renowned index that it is traded worldwide, leading to an almost endless supply of ETFs replicating it. Therefore, our team has gathered a selection to showcase in this article.
| Name | ISIN | Ticker* | Annual fee (TER) | Replication method | Use of income |
| iShares Core S&P 500 UCITS ETF | IE00B5BMR087 | CSSPX | 0.07% | Physical | Accumulating |
| Vanguard S&P 500 UCITS ETF | IE00B3XXRP09 | VUSA | 0.07% | Physical | Distributing |
| Invesco S&P 500 UCITS ETF | IE00B3YCGJ38 | SPXS | 0.05% | Synthetic | Accumulating |
| Xtrackers S&P 500 Swap UCITS ETF | LU0490618542 | XSPX | 0.15% | Synthetic | Accumulating |
| SPDR® S&P® 500 UCITS ETF | IE00B6YX5C33 | SPY5 | 0.03% | Physical | Distributing |
*Tickers shown refer to the Borsa Italiana listing. The same ETFs are available on other European exchanges (London Stock Exchange, Xetra, Euronext Amsterdam, SIX Swiss Exchange) under different tickers. Data as of June 2026 – TERs are subject to change and should be verified on the issuer’s website before investing.
A few notes on the S&P 500 ETF landscape:
- Cost competition has intensified: the cheapest options now have TERs as low as 0.03% (SPDR SPY5) and 0.05% (Invesco SPXS) – representing one of the most competitive cost environments in any ETF segment;
- Physical vs synthetic: physical replication is more transparent (the ETF actually holds the underlying stocks), while synthetic replication uses swap agreements – the latter can deliver slightly better tracking on US equities thanks to a specific US dividend tax treatment, but introduces counterparty risk;
- Accumulating vs distributing: accumulating ETFs (CSSPX, SPXS, XSPX) automatically reinvest dividends, while distributing ETFs (VUSA, SPY5) pay them out – the choice depends on whether you want regular income or fully compounded growth, and on the tax treatment in your country.
MSCI World
The availability of ETFs tracking the MSCI World Index is limited, with fewer exchanges offering such options. Investing in the MSCI World Index presents a restricted range of choices, primarily centred around ETFs listed on the Euronext Amsterdam, XETRA and Borsa Italiana.
| Name | ISIN | Ticker* | Annual fee (TER) | Replication method | Use of income |
| UBS MSCI World UCITS ETF (USD) A-acc | IE00BD4TXV59 | WRDA | 0.10% | Physical | Accumulating |
| SPDR MSCI World UCITS ETF | IE00BFY0GT14 | SWRD | 0.12% | Physical | Accumulating |
| HSBC MSCI World UCITS ETF USD (Dist) | IE00B4X9L533 | HMWD | 0.15% | Physical | Distributing |
| HSBC MSCI World UCITS ETF USD (Acc) | IE000UQND7H4 | HMWA | 0.15% | Physical | Accumulating |
| Invesco MSCI World UCITS ETF | IE00B60SX394 | SMSWLD | 0.19% | Synthetic | Accumulating |
| iShares Core MSCI World UCITS ETF USD (Acc) | IE00B4L5Y983 | SWDA | 0.20% | Physical | Accumulating |
| iShares MSCI World UCITS ETF (Dist) | IE00B0M62Q58 | IWRD | 0.50% | Physical | Distributing |
*Tickers shown refer to the Borsa Italiana or major European listing. The same ETFs are available on other European exchanges (XETRA, Euronext Amsterdam, London Stock Exchange, SIX Swiss Exchange) under different tickers. Data as of June 2026 – TERs are subject to change and should be verified on the issuer’s website before investing.
Key observations on the MSCI World ETF landscape:
- The MSCI World ETF market has become more competitive: TERs now start at 0.10% (UBS WRDA) and 0.12% (SPDR SWRD) – meaningfully lower than the most popular option, iShares SWDA at 0.20%, despite SWDA being the largest by far ($144+ billion AUM);
- The iShares “premium”: SWDA charges 0.20% partly because of its size and liquidity advantage – it’s the most heavily traded MSCI World ETF and benefits from the tightest bid-ask spreads. The cost difference vs WRDA is approximately €10 per year per €10,000 invested – meaningful over decades but modest in absolute terms;
- Distributing vs accumulating: most modern MSCI World ETFs offer both share classes. The older iShares IWRD (TER 0.50%) is largely a legacy share class and is generally not recommended for new investments – SWDA (accumulating) or HMWD (distributing) offer the same exposure at a lower cost;
- Synthetic alternative: the Invesco SMSWLD uses synthetic replication, which can deliver marginal tracking advantages on US dividend-heavy holdings, though most European investors prefer the transparency of physical replication.
Best brokers to invest in S&P 500 and MSCI World ETFs
Now that you understand the differences between the two indices and have an idea of which ETFs you’d like to invest in, the next step is choosing the right broker. We’ve evaluated the most important features of European ETF brokers – including ETF selection, fees, account minimums, and supported account currencies – and compiled the following shortlist of five European brokers worth considering.
Each broker has different strengths depending on your investing style and priorities:
- eToro: best for social trading and commission-free real stock and ETF investing – publicly listed on NASDAQ (ticker ETOR since May 2025) with 40+ million users globally;
- Interactive Brokers: best for the largest ETF offering and global market access – NASDAQ-listed S&P 500 constituent (since 2024) providing access to 170+ markets across 36+ countries;
- DEGIRO: best for low-cost ETF trading – part of flatexDEGIRO Bank AG with broad European retail presence, free trading on a selection of ETFs;
- Trading 212: best for commission-free stock and ETF trading – with AutoInvest, Pies, and fractional shares for systematic investors;
- Freedom24: best for access to high-yield ETFs and bonds – part of Freedom Holding Corp (NASDAQ: FRHC) with one of the broadest ETF universes available in Europe.
Disclaimer: Investing involves risk of loss; eToro is a multi-asset investment platform. The value of your investments may go up or down. Your capital is at risk. Other fees apply. For more information, visit etoro.com/trading/fees.
| Broker | ETF fees | Minimum Deposit | Number of ETFs | Regulators |
| eToro | $0 (other fees apply) | $50 (varies between countries) | 260+ | FCA, CySEC, ASIC |
| Interactive Brokers | Varies by exchange with tiered Pricing: 0.05% of Trade Value (min: €1.25, max: €29.00) | €/$/£0 | 13,000+ | FINRA, SIPC, SEC, CFTC, IIROC, FCA, CBI, AFSL, SFC, SEBI, MAS, MNB |
| DEGIRO | €/£0 (in some ETFs, + a €/£1 handling fee), plus an annual €/£2.50 connectivity fee | €/£1 | 200+ | DNB and AFM |
| Trading 212 | €/£0 | €/£0 | 600+ | FCA, CySEC, BaFin, ASIC |
| Freedom24 | €0 | €0 | 3,600+ | CySEC |
Conclusion
By investing in the MSCI World index, you can benefit from broader global diversification across various geographies (and sectors). As such, this index gives you direct exposure to international markets beyond the US, contrary to the S&P 500. With a larger number of companies in its index, it offers you the opportunity to diversify your investments further.
Additionally, you can choose from multiple exchange-traded funds (ETFs) that track the performance of the S&P 500 and MSCI World indices.
In summary, if you’re looking to expand your investment horizons, the MSCI World index provides a more comprehensive global perspective compared to the US-focused S&P 500, offering you the potential for enhanced diversification in your portfolio.
Disclaimer: When investing, your capital is at risk and you may get back less than invested. Past performance doesn’t guarantee future results.