In this article we compare two of the most widely held ETFs in the world: Invesco’s QQQ and State Street’s SPY.
Both attract enormous investor interest, and both have delivered strong long-term returns. But they are not competing products in the way head-to-head comparisons often suggest – their composition, concentration, and risk profile differ substantially.
We cover track record, total expense ratio, portfolio composition, risk-adjusted performance, and dividend policy, so you can judge which exposure fits your own portfolio.
The short version: QQQ gives you 100 companies concentrated in technology and growth. SPY gives you 500 companies spanning the US economy. Neither is objectively better – they answer different questions.
Key data
| ETF | QQQ | SPY |
| Full name | Invesco QQQ Trust | SPDR S&P 500 ETF Trust |
| Asset manager | Invesco | State Street Investment Management |
| Index tracked | Nasdaq-100 | S&P 500 |
| Number of holdings | ~100 | ~500 |
| Inception date | March 1999 | January 1993 |
| Fund currency | USD | USD |
| Replication | Physical | Physical |
| Structure | Unit investment trust | Unit investment trust |
| TER | 0.20% p.a. | 0.09% p.a. |
| Distribution | Distributing, quarterly | Distributing, quarterly |
| UCITS equivalent | EQQQ | SPY5 |
AUM, yields, and performance figures change continuously. Verify current data on the provider’s factsheet before investing. Sources: Invesco, State Street, Morningstar.
Important note for European investors
QQQ and SPY are US-domiciled and cannot be bought by EU retail investors under PRIIPs regulation, which requires funds marketed in the EU to publish a standardised Key Information Document. US issuers generally do not produce one.
European investors have two practical routes:
- UCITS equivalents: the Invesco EQQQ (Nasdaq-100) and SPDR SPY5 (S&P 500) track the same indices in an EU-compliant structure. Both are available on European exchanges;
- Irish-domiciled alternatives: for S&P 500 exposure specifically, several Irish-domiciled UCITS ETFs carry lower TERs than SPY5, and Irish domicile reduces US dividend withholding tax from 30% to 15% at fund level.
UK investors face the same restriction. Everything below about index composition and risk applies equally to the UCITS versions, though costs and tracking differ slightly.
QQQ vs SPY at a glance
| Performance | QQQ has outperformed SPY over most long periods since 1999, driven by the technology sector’s dominance. It has also fallen further in downturns – notably 2000-2002 and 2022. |
| Cost | SPY is cheaper at 0.09% against QQQ’s 0.20%. On $10,000 that is $9 versus $20 annually. |
| Diversification | SPY holds around 500 companies across every sector. QQQ holds around 100, heavily weighted toward technology, with no dedicated financials or energy exposure. |
| Concentration | Both are top-heavy, but QQQ considerably more so. Its largest holdings represent a substantially greater share of the fund than SPY’s do. |
| Volatility | QQQ is materially more volatile. Higher returns have come with deeper drawdowns. |
| Income | SPY yields more, since growth companies typically retain earnings rather than distributing them. |
Comparison: QQQ vs SPY
We assess both funds across five dimensions:
- Performance and drawdowns
- Total expense ratio
- Portfolio structure and concentration
- Risk-adjusted returns
- Dividend policy
A methodological point worth stating: comparing performance from QQQ’s 1999 inception is common but misleading, since it starts immediately before the dot-com crash. Different start dates produce sharply different conclusions – a reminder that any single comparison window reflects the period chosen as much as the funds themselves.
Performance and drawdowns
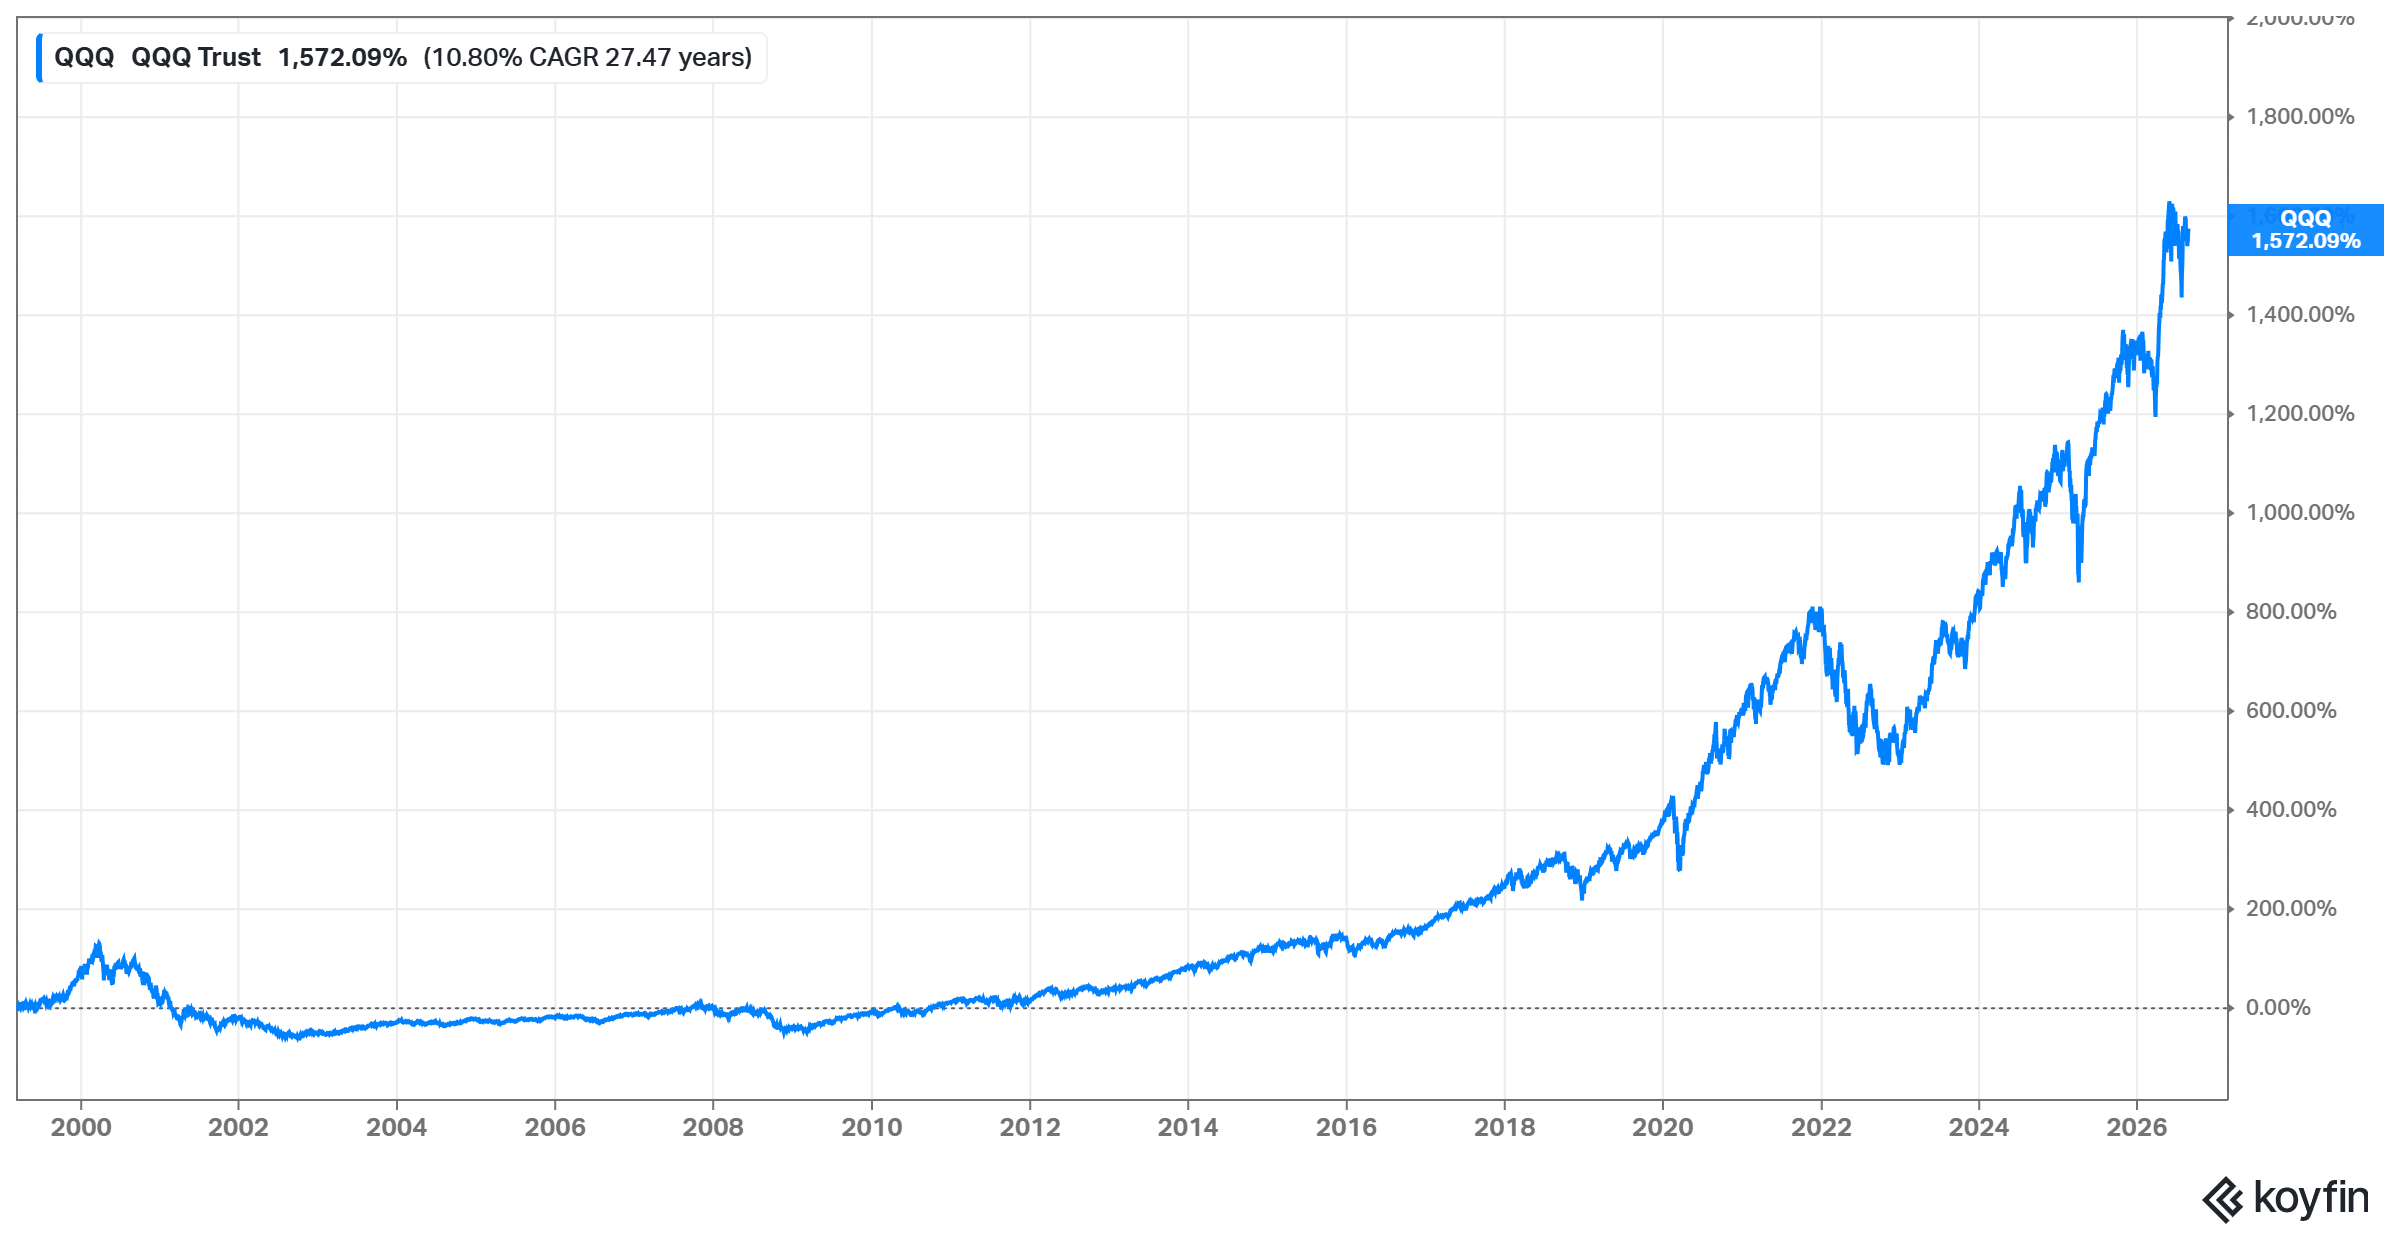
QQQ has delivered stronger cumulative returns than SPY over most measurement periods since inception, reflecting the outperformance of large technology companies over the past two decades.
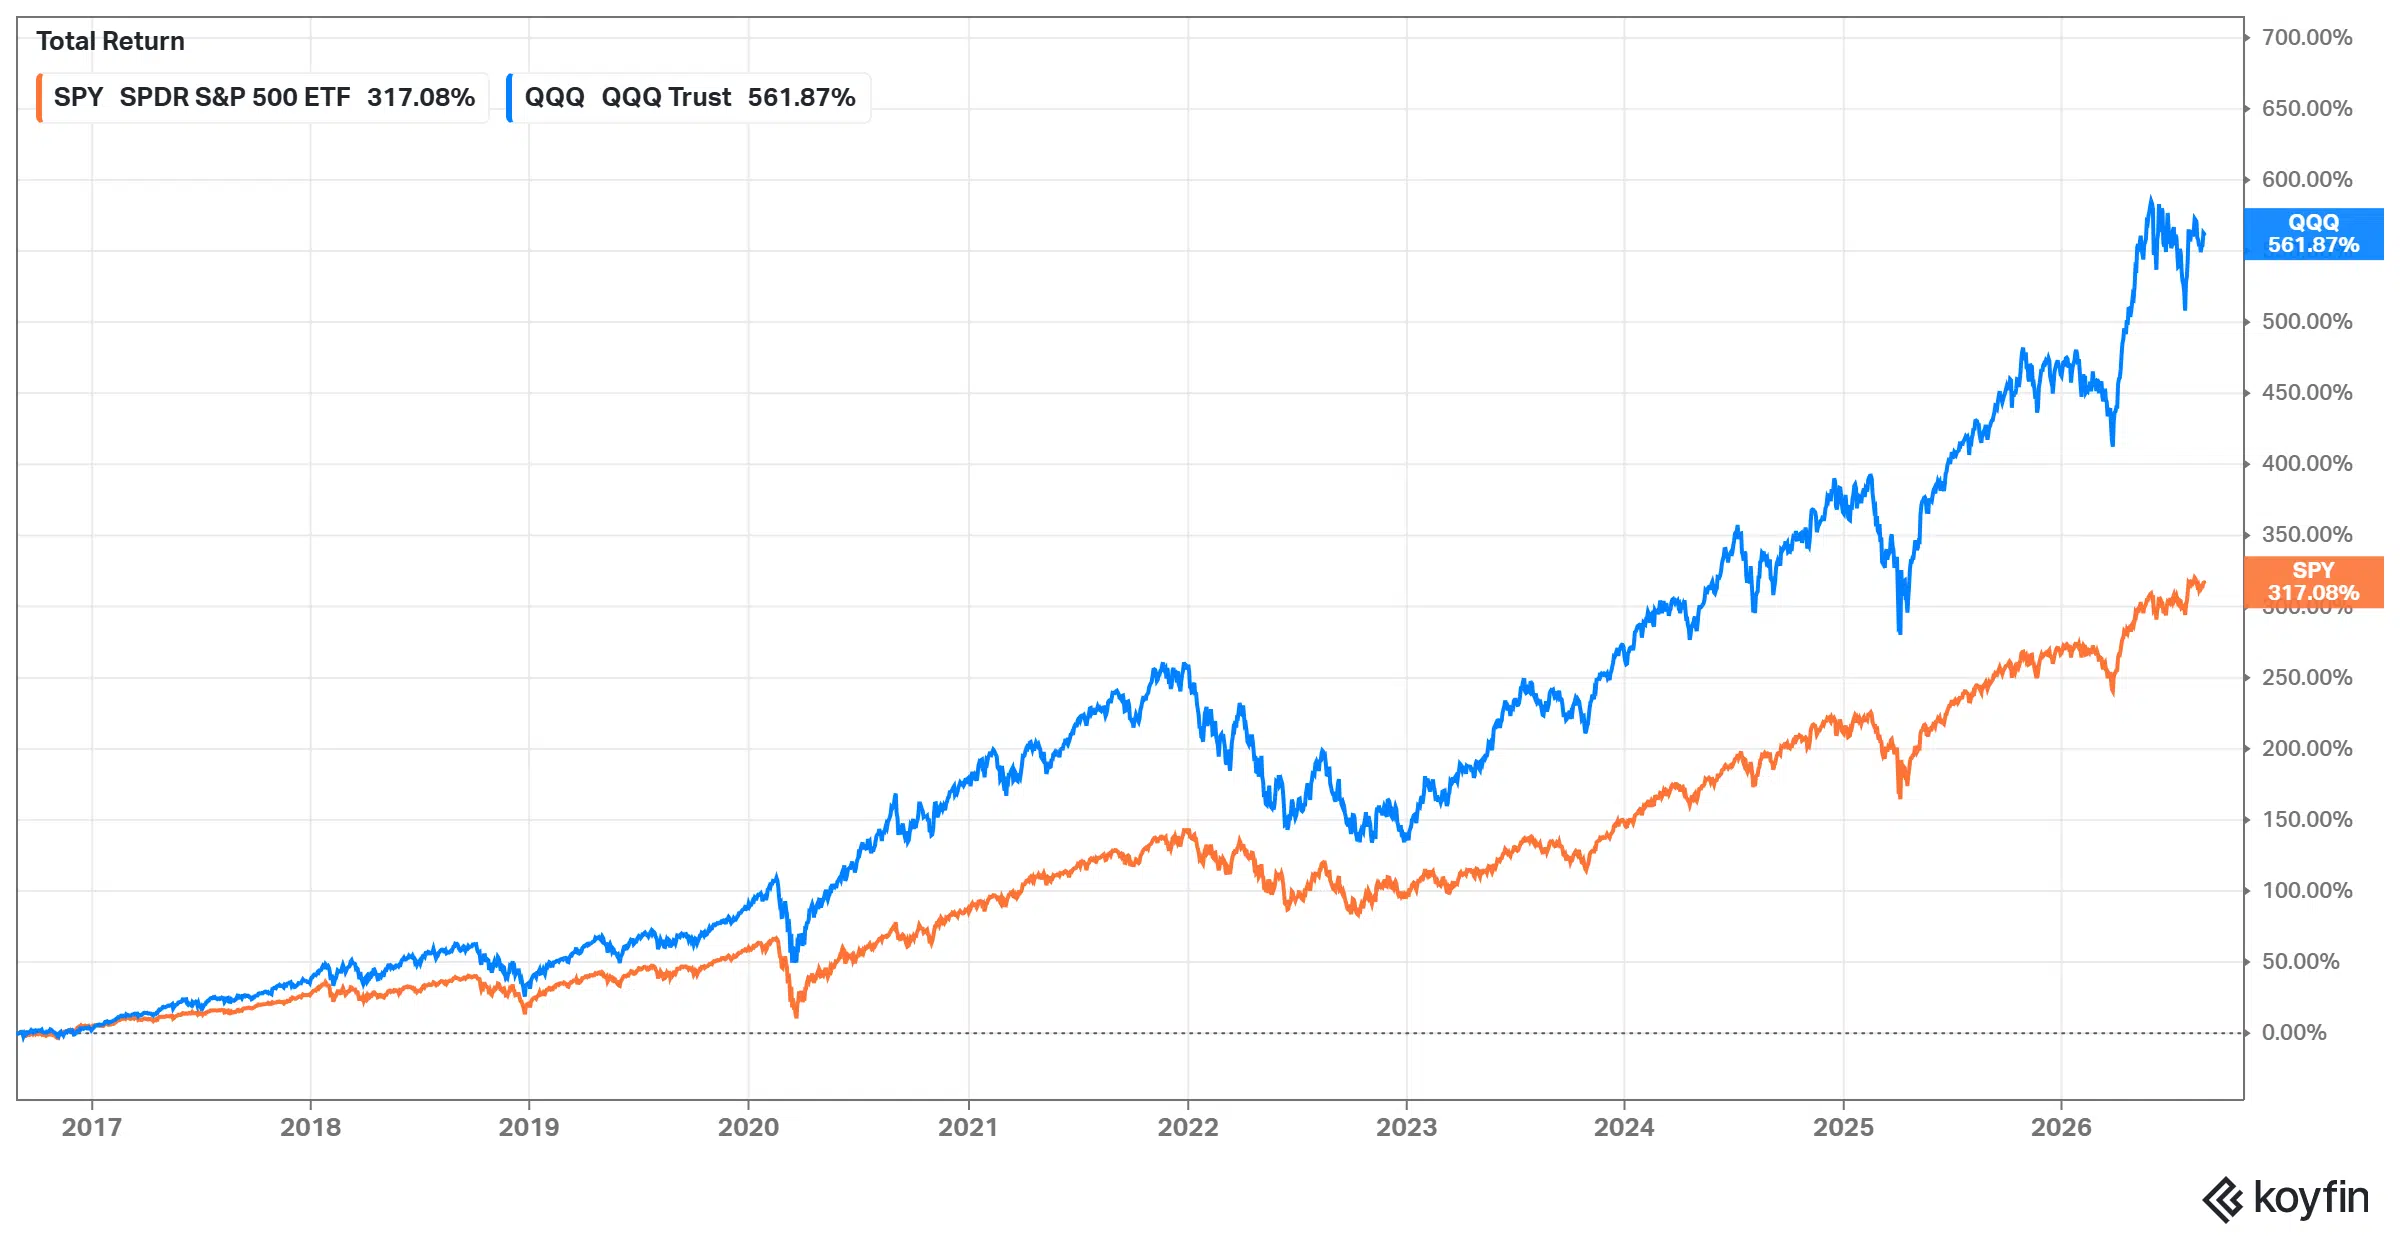
That outperformance comes with a cost that cumulative return charts obscure: QQQ falls considerably harder when technology corrects.
Two episodes illustrate the point. Following the dot-com peak in 2000, QQQ lost roughly 80% of its value and took until 2015 – fifteen years – to recover its previous high. SPY fell around half as much and recovered years earlier. In 2022, QQQ declined roughly a third against SPY’s fall of under 20%.
The practical question is not which returns more, but whether you would hold through those declines. Selling near the bottom converts a temporary drawdown into a permanent loss, and higher volatility makes that considerably harder to avoid.
Total expense ratio
The TER covers a fund’s ongoing running costs, excluding trading commissions. It is deducted from returns automatically, so lower is better all else equal.
SPY charges 0.09% against QQQ’s 0.20%. On a $10,000 holding, that is $9 versus $20 a year.
Two points of context. Over 20 years, an 0.11 percentage point difference compounds meaningfully – though on the returns these funds have delivered, it is not the dominant factor.
More usefully: both are expensive relative to alternatives tracking the same indices. Several S&P 500 ETFs charge 0.03% or less, and cheaper Nasdaq-100 options exist too. SPY and QQQ command a premium for liquidity – they are the most heavily traded ETFs in their categories, with very tight spreads, which matters to active traders and options users but rarely to long-term investors.
If you are buying and holding, a cheaper fund tracking the same index will likely serve you better.
Portfolio structure and concentration
Both funds invest almost entirely in the United States, but their indices differ fundamentally. QQQ tracks the Nasdaq-100; SPY tracks the S&P 500.
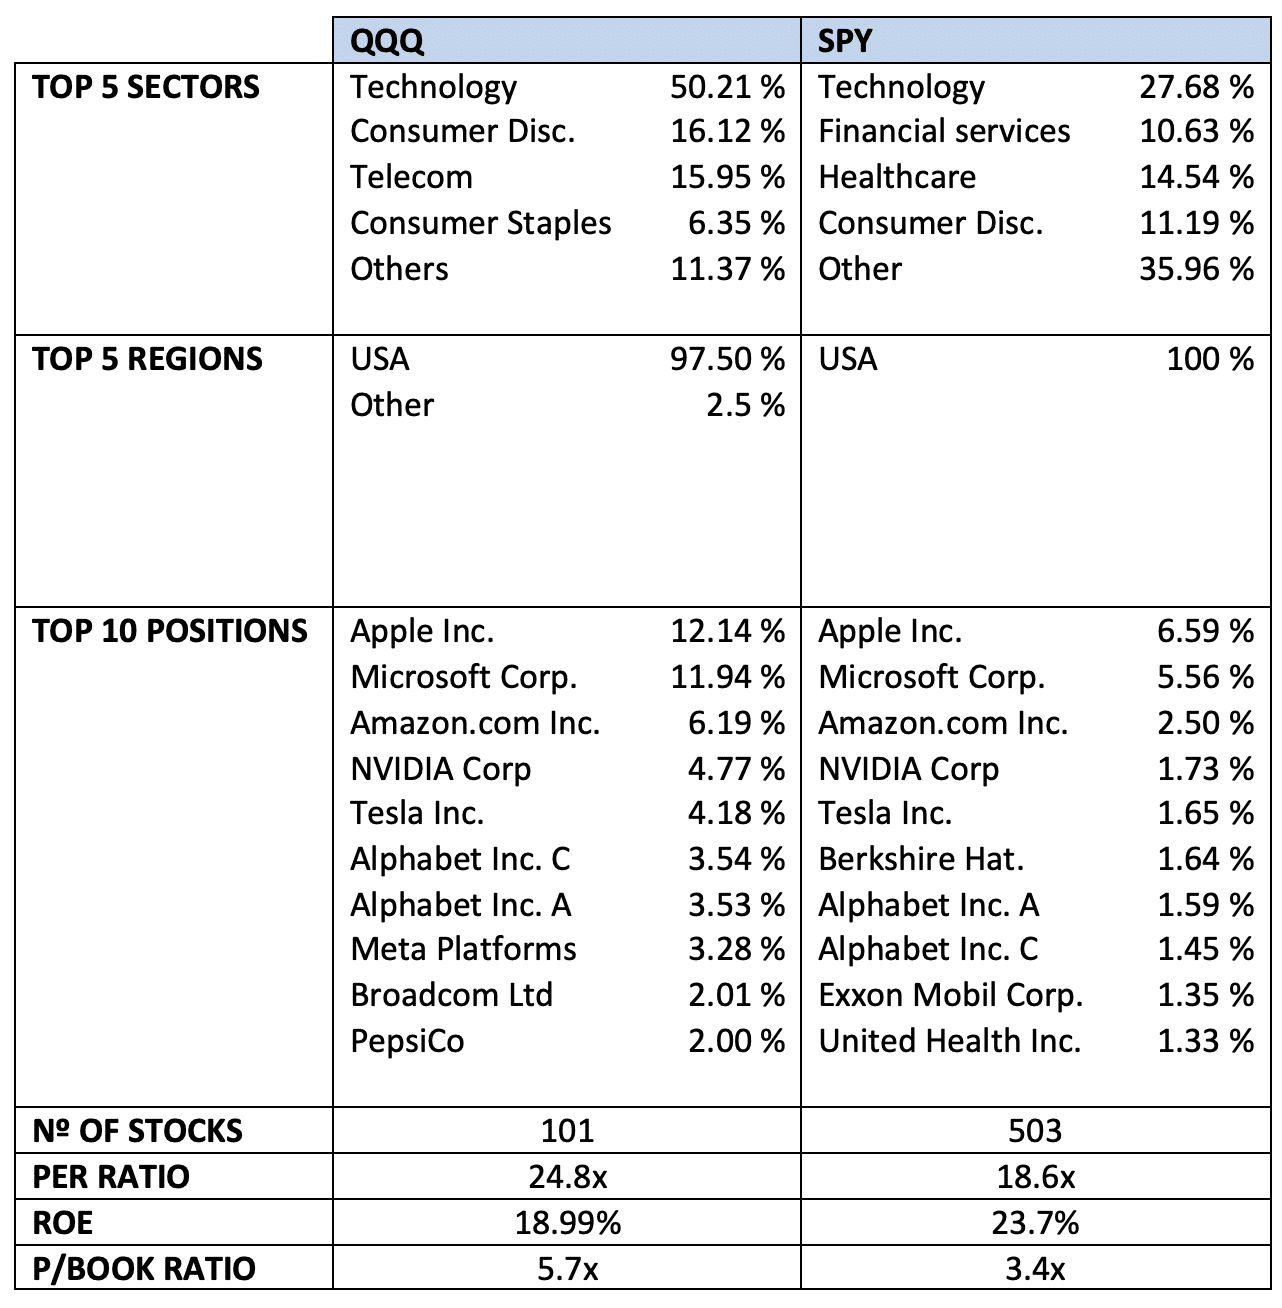
The differences that matter:
- Breadth: around 500 holdings in SPY against 100 in QQQ;
- Sector exposure: QQQ is heavily weighted toward technology and communication services, with limited healthcare, industrials, and energy, and comparatively little financials exposure. SPY spans all eleven GICS sectors roughly in proportion to their market weight;
- Concentration: both have become more top-heavy as the largest US companies have grown, but QQQ substantially more so. Its top ten holdings represent a considerably larger share of the fund;
- Overlap: this is the point most comparisons miss. Nearly every QQQ holding also appears in SPY, since the Nasdaq-100’s constituents are among the largest US companies. Holding both is less diversifying than it appears – it mainly increases your weighting to large-cap technology.
On valuation, QQQ typically trades at higher price-to-earnings and price-to-book multiples than SPY. That reflects the growth expectations embedded in its holdings rather than indicating either is mispriced. A higher multiple means more of the current price depends on future earnings materialising – which cuts both ways.
Risk-adjusted returns
The Sharpe ratio measures return generated per unit of volatility, allowing a fairer comparison between funds with different risk profiles.
Which fund scores better depends heavily on the period measured. Over windows dominated by technology strength, QQQ typically leads; over periods including a technology correction, SPY usually does. That instability is itself informative – QQQ’s risk-adjusted advantage is not a persistent property but a function of when you measure.
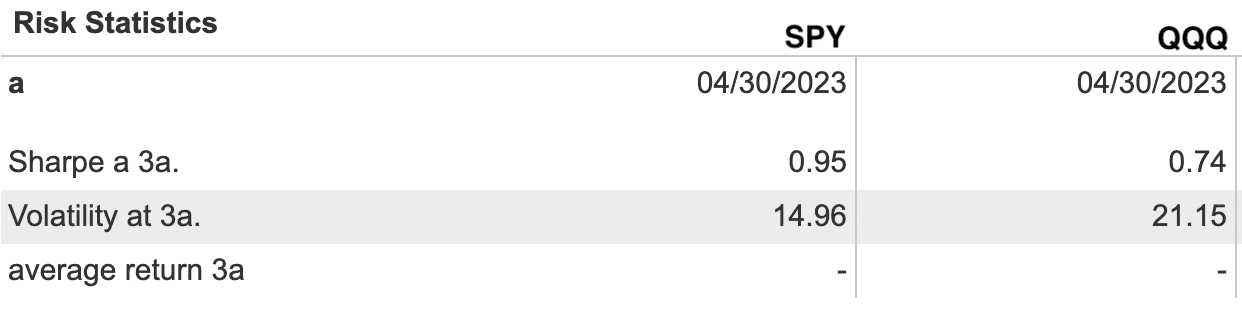
Two measures matter more than Sharpe for most investors:
- Maximum drawdown: the largest peak-to-trough fall. QQQ’s has been consistently deeper, and this is what tests whether you can hold;
- Recovery time: how long to regain a previous high. QQQ took fifteen years after 2000 – long enough to matter greatly if you needed the money in that window.
Check current figures on Morningstar or the provider factsheets, since all of these shift with each new period of data.
Dividend policy
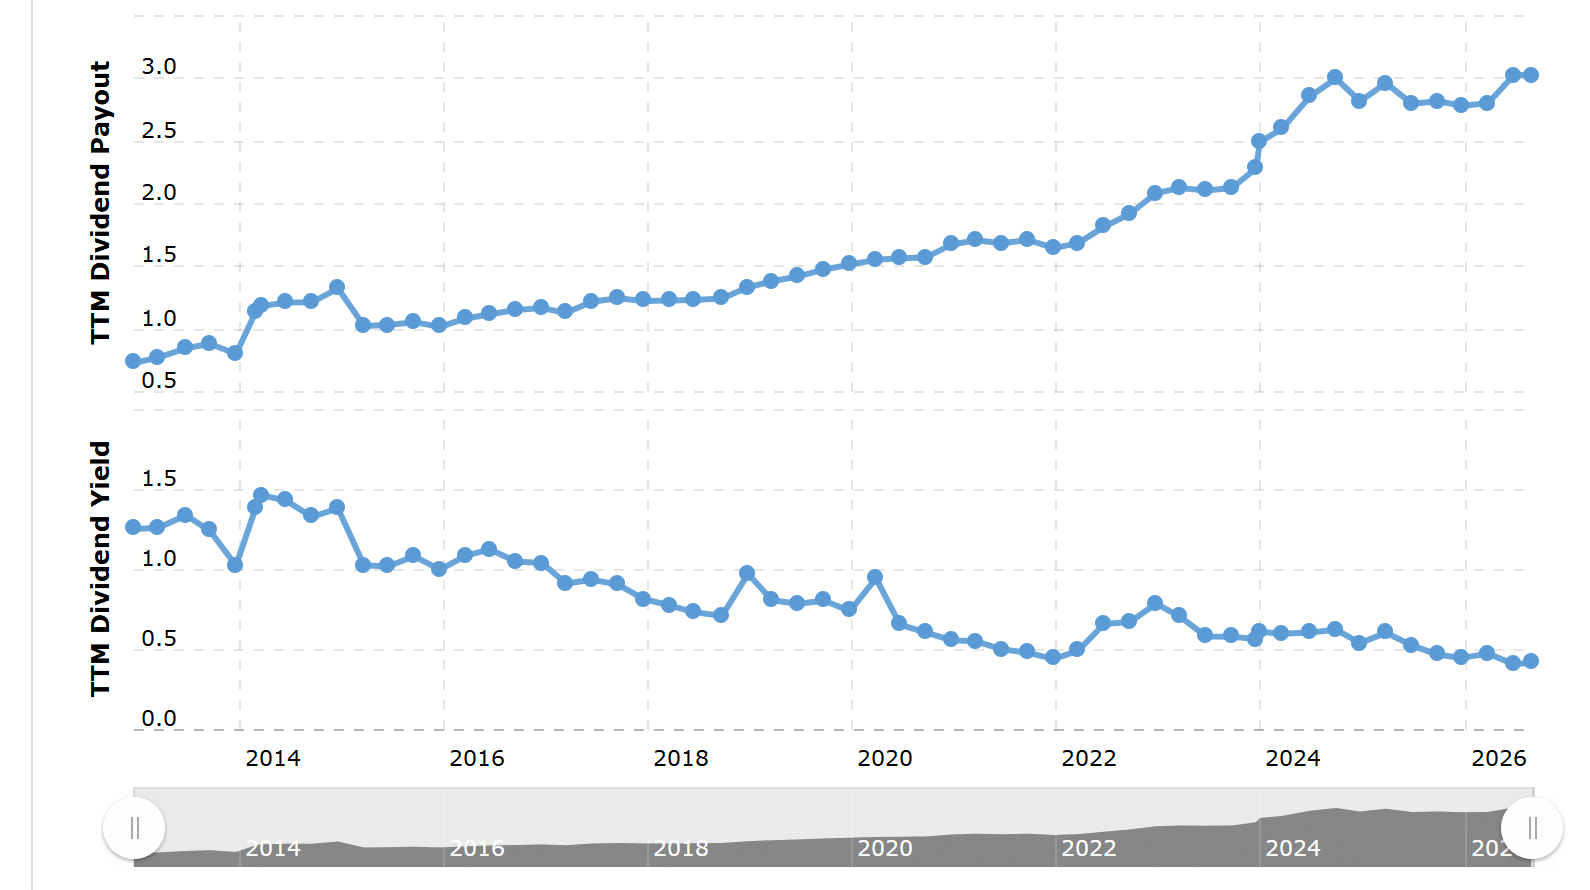
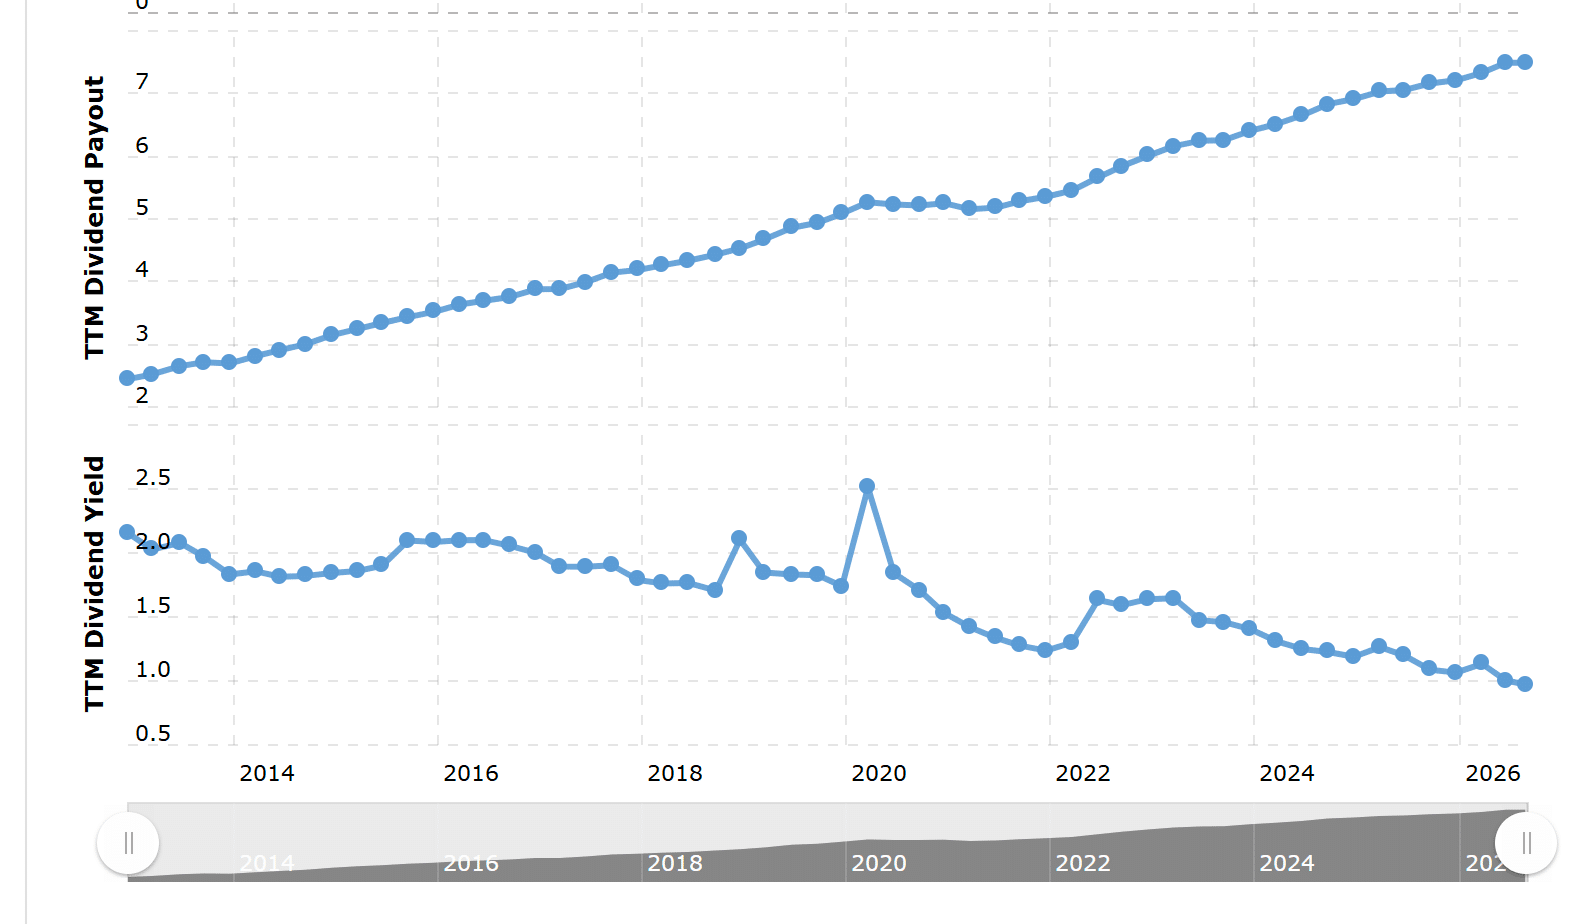
Both funds distribute quarterly rather than accumulating. SPY yields more than QQQ, typically by a meaningful margin.
That gap is structural rather than a quality difference. Growth companies, which dominate the Nasdaq-100, typically retain earnings to reinvest rather than distributing them, while the broader S&P 500 includes more mature, dividend-paying businesses across financials, utilities, energy, and consumer staples.
Two implications worth noting:
- Total return matters more than yield. A fund yielding less but appreciating more can deliver a better outcome. Yield alone tells you how returns are delivered, not how large they are;
- Distributing funds create a tax event. Dividends are taxable on receipt in most jurisdictions regardless of whether you reinvest them. Non-US investors also face US withholding tax – 30%, or 15% where a treaty applies and a W-8BEN is filed. Investors focused on accumulation may prefer an accumulating UCITS equivalent.
What is QQQ?
The Invesco QQQ Trust is among the largest and most heavily traded ETFs in the world, tracking the Nasdaq-100 index. It is consistently among the top ETFs by daily volume in the US, and its options market is one of the deepest available.
European investors can access the same index through the UCITS version, EQQQ.
QQQ’s long-term performance has been strong, driven by the technology sector’s expansion since the mid-2000s.
About the Nasdaq-100 index
Launched in 1985, the Nasdaq-100 comprises the 100 largest non-financial companies listed on the Nasdaq exchange, weighted by modified market capitalisation.
Two features distinguish it from the S&P 500:
- Exchange-based selection: only Nasdaq-listed companies qualify, which excludes large NYSE-listed businesses regardless of size. This is a listing-venue criterion rather than a sector one, though it produces a technology tilt in practice;
- No financials: the index excludes companies classified as financials, which removes banks and insurers entirely.
Constituents are reviewed annually in December, though special rebalances occur outside that schedule when concentration limits are breached – as happened in July 2023, when the weights of the largest holdings were reduced to comply with diversification rules.
That mechanism is worth understanding: the index has built-in caps preventing any single company from dominating entirely, which triggers periodic forced rebalancing.
QQQ portfolio composition
QQQ gives access to many of the world’s largest technology companies, alongside a smaller allocation to consumer, healthcare, and industrial names listed on Nasdaq.
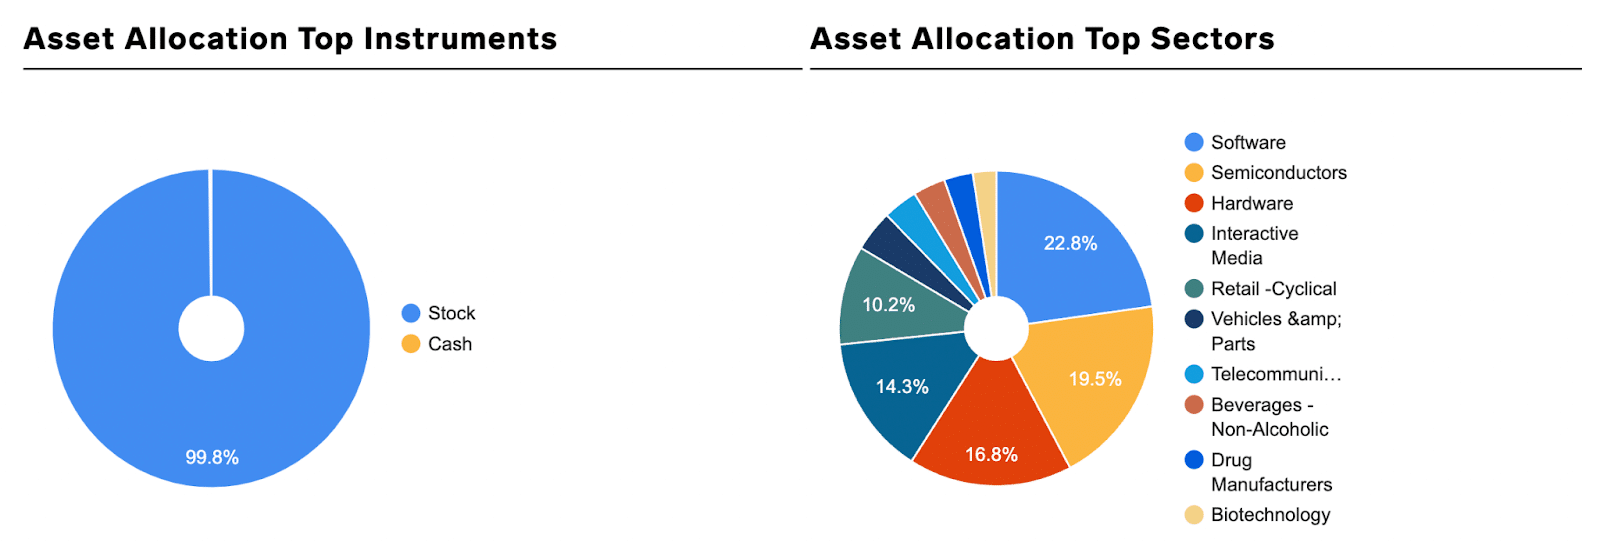
Geographically, the fund is almost entirely US-based, with a small allocation to companies domiciled elsewhere but Nasdaq-listed.
Note that constituents change with index reviews – companies are added and removed each year, so check the current holdings on Invesco’s factsheet rather than relying on any published list.
About Invesco
Invesco is an independent US investment manager headquartered in Atlanta, operating across more than 20 countries and listed on the NYSE (ticker: IVZ). It manages approximately $2.45 trillion across more than 500 funds and ETFs.
Beyond QQQ, Invesco is known for products including Invesco Physical Gold and a broad range of equity and fixed income strategies.
What is SPY?
If QQQ is a category leader, SPY is the original. Launched in January 1993, it was the first ETF listed in the United States and remains the largest and most heavily traded ETF in the world.
Its scale gives it exceptionally tight spreads and the deepest options market of any ETF – which is why institutional investors and traders use it heavily, even though cheaper S&P 500 funds exist.
SPY distributes dividends quarterly. European investors can access the same index through the UCITS version, SPY5, though other Irish-domiciled S&P 500 ETFs are often cheaper.
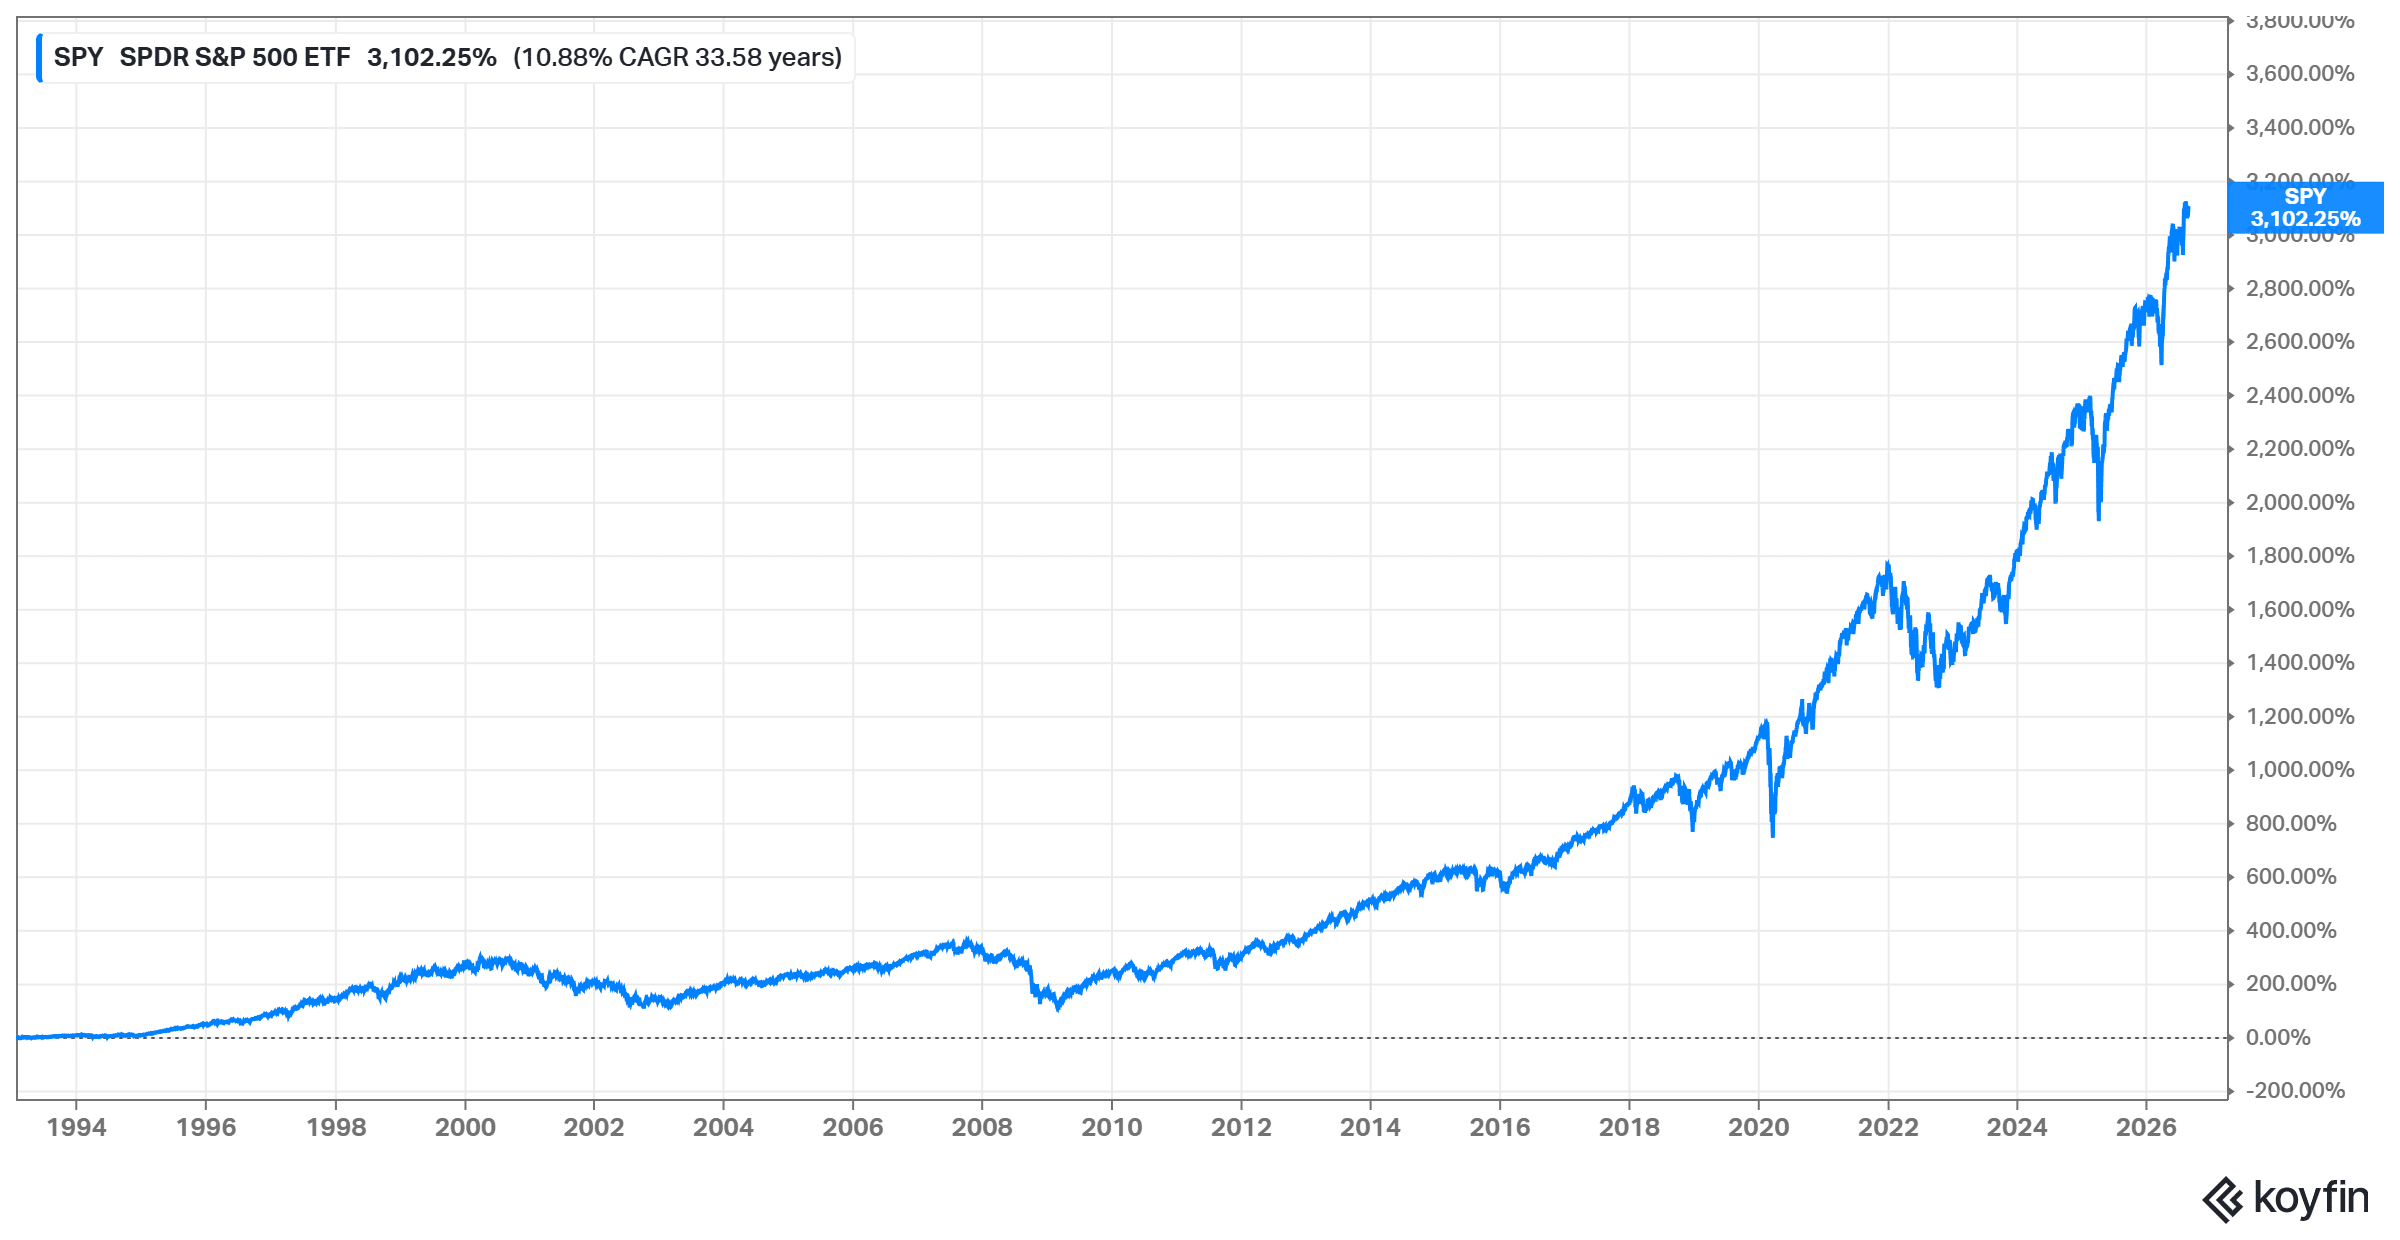
Since inception, SPY has delivered substantial cumulative returns including dividends, reflecting more than three decades of US equity market growth.
About the S&P 500 index
The S&P 500, maintained by S&P Dow Jones Indices, launched in its current form in 1957 and covers around 500 large US companies representing roughly 80% of total US market capitalisation.
Unlike the Nasdaq-100’s exchange-based criterion, S&P 500 membership is decided by a committee applying rules on market capitalisation, liquidity, US domicile, public float, and profitability – a company must have posted positive earnings over recent quarters to qualify.
That profitability requirement is a meaningful difference: the index excludes large loss-making companies that the Nasdaq-100 might include.
The index holds slightly more than 500 securities, since some companies have multiple share classes.
SPY portfolio composition
SPY provides exposure to leading US companies across every major sector – technology, healthcare, financials, consumer, industrials, energy, and utilities among them.
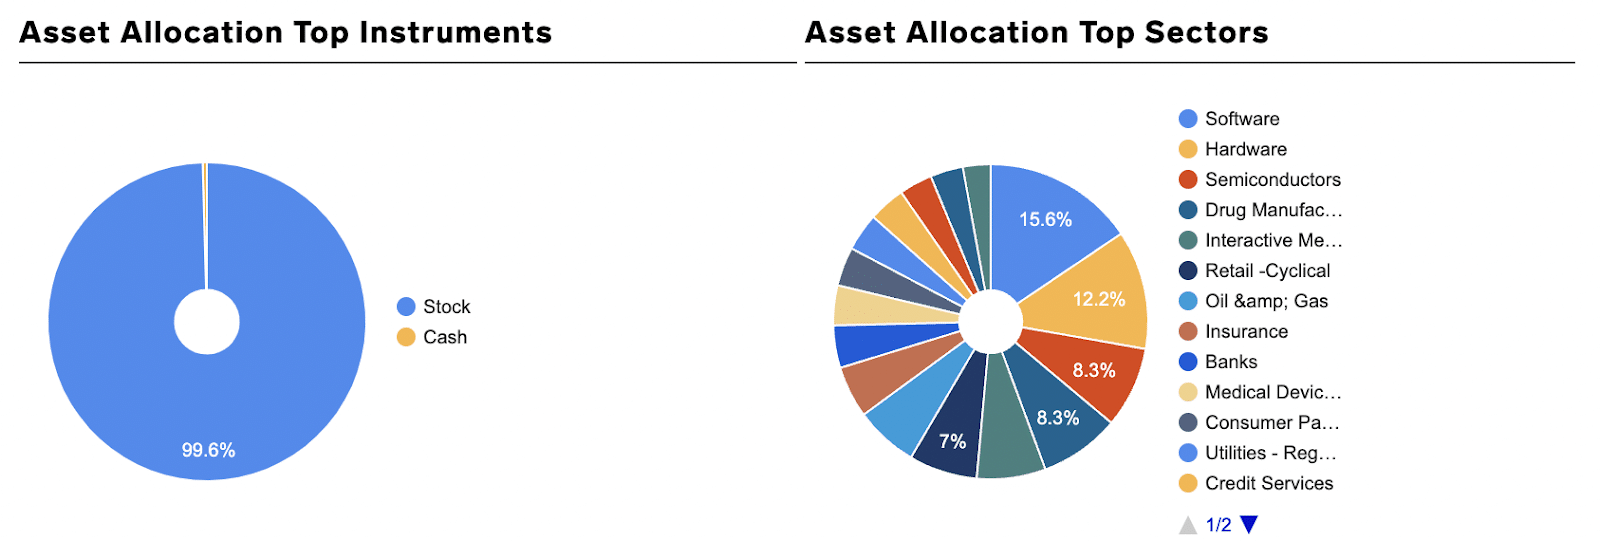
Holdings are almost entirely US-domiciled, as the index requires.
Worth noting that despite holding 500 companies, SPY has become increasingly concentrated – the largest holdings now represent a substantially greater share of the index than they did a decade ago. It remains far more diversified than QQQ, but less so than the headline number suggests.
About State Street
SPY heads the SPDR range, the ETF family State Street created in the 1990s. Alongside BlackRock and Vanguard, State Street Investment Management is one of the world’s largest asset managers, with approximately $6.28 trillion under management.
The investment management business was founded in 1978, and rebranded from State Street Global Advisors in 2025. Its parent, State Street Corporation, traces its roots to 1792 and also operates one of the largest custody businesses globally, servicing over $54 trillion in assets.
Which should you choose?
The choice depends on the role the fund plays in your portfolio.
SPY, or a cheaper S&P 500 equivalent, suits a core holding. It gives broad exposure to the US economy at low cost, with diversification across sectors that limits the damage when any one falls out of favour. For most investors building a long-term portfolio, this is the more appropriate foundation.
QQQ suits a satellite position for investors specifically wanting greater technology and growth exposure, and who can tolerate deeper drawdowns without selling. It is a bet on a particular part of the market continuing to outperform – a reasonable view to hold, but one that should be held deliberately rather than by default.
Holding both adds less than it appears. Because most QQQ constituents already sit within SPY, combining them primarily increases your large-cap technology weighting rather than diversifying. If that is what you want, it is a valid choice; just be clear that is what you are doing.
For genuine diversification alongside either, a global or ex-US fund adds exposure these two do not provide at all.
A final consideration for European and UK investors: since neither fund is available to you directly, compare the UCITS alternatives on TER, fund size, and domicile. Irish-domiciled funds generally handle US dividend withholding more efficiently, and several charge considerably less than SPY5 or EQQQ for equivalent exposure.
Where to invest in QQQ and SPY
The brokers below offer competitive pricing on ETFs. European investors should note that they will be buying the UCITS versions rather than the US-listed funds.
| Broker | ETF fees | Available ETFs | Minimum deposit | Other costs |
| Interactive Brokers | 0.05% of trade value (€1.25 min, €29 max) | 13,000+ | €0 | FX conversion at ~0.20 basis points |
| Trading 212 | €0 | Wide selection | €1 | 0.15% currency conversion |
| DEGIRO | €0 on Core Selection ETFs (€1 handling fee); €2 on others | 200+ Core Selection | €0.01 | €2.50 annual connectivity fee per exchange; FX costs |
Disclaimer: when investing, your capital is at risk and you may get back less than you invested. Past performance does not guarantee future results.
Conclusion
QQQ and SPY are both high-quality funds tracking well-constructed indices, and neither is a poor choice. But they are not interchangeable.
QQQ has delivered stronger long-term returns, concentrated in around 100 technology-weighted companies, at a higher cost and with substantially deeper drawdowns. SPY offers broader exposure across roughly 500 companies, at less than half the expense ratio, with a higher yield and a smoother ride.
The more useful framing is not which performs better – that depends entirely on the period you measure – but which exposure you actually want. Concentrated growth, or broad market coverage.
Two closing points. Cost matters over long holding periods, and both funds are more expensive than alternatives tracking the same indices, so compare before committing. And whichever you choose, neither provides exposure outside the United States – something worth addressing separately if you want a genuinely diversified portfolio.