The last few years have been a financial roller-coaster. The pandemic, the sharpest inflation in 40 years, the fastest rate rises in decades and big swings in housing markets have all left their mark on household finances, and 2026 has brought a new inflation bump driven by energy prices.
In this article, we have gathered the most useful personal finance statistics available in 2026, from how people feel about their money to what they actually own. They help separate common myths from the data and show where most people have room to improve.
The current state of personal finance
1. A third of Americans say they are struggling or in crisis financially
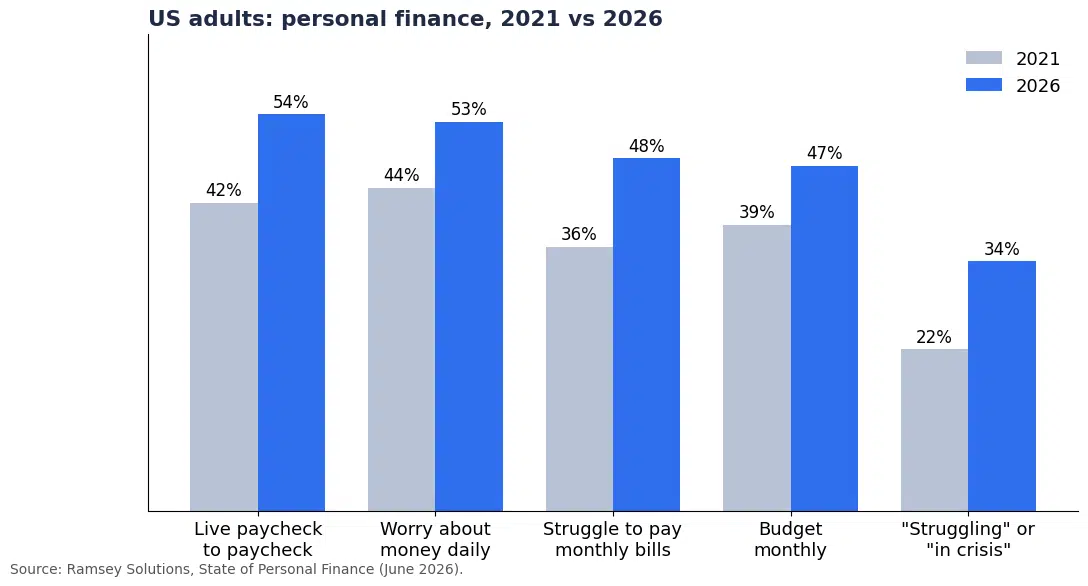
According to the State of Personal Finance study by Ramsey Solutions, 34% of Americans describe their financial situation as “struggling” or “in crisis” in 2026, up from 22% when the survey started in 2021. Only 26% say they are better off than a year ago.
The same survey still finds a lot of optimism about the long run: 74% expect to be better off in five years’ time.
2. Nearly half of Americans struggle to pay their bills
Ramsey’s 2026 figures show that 48% of Americans struggle to pay their monthly bills, up from 36% five years earlier, and 51% have faced an unexpected financial emergency in the last five years.
Among renters the pressure is higher still, with a majority reporting difficulty keeping up with payments.
3. Women face greater financial challenges than men
A LendingTree survey of nearly 2,000 US consumers found that 37% of women are unable to save money, compared with 22% of men, even though women were less likely to splurge or go into debt for nonessential spending. Only 23% of women said they were doing well financially, 11 percentage points behind men.
Income is a large part of the explanation: according to Pew Research Center, women earned 82% of what men earned in 2022. The same pattern shows up in wealth data, as we cover in the net worth section below.
4. More than half of Americans live paycheck to paycheck
54% of Americans say they live paycheck to paycheck in 2026, up from 42% in 2021, according to Ramsey Solutions. The same share (54%) say they can’t get ahead financially, and 53% worry about money every day.
Living paycheck to paycheck is not only a low-income problem: it describes anyone whose spending absorbs their income, which leaves no buffer for emergencies.
Source: Ramsey Solutions, State of Personal Finance (June 2026).
5. Fewer than half of Americans keep a monthly budget
Just 47% of Americans say they create a monthly budget in 2026, according to Ramsey. That is up from 39% in 2021, so budgeting is becoming more common, especially among Generation Z (53%, up from 38%). Still, most adults run their finances without one.
Emergency and retirement savings show the same gap. According to the Federal Reserve’s Survey of Household Economics and Decisionmaking (SHED), conducted in October 2025:
- Emergency savings: 63% of adults would cover a $400 emergency expense with cash or its equivalent, which means 37% could not.
- Rainy day fund: 55% have enough set aside to cover three months of expenses.
- Retirement: only 35% of non-retired adults think their retirement savings plan is on track, down from 40% in 2021.
6. Credit card debt and car payments weigh on household budgets
Americans owed $18.8 trillion in total household debt in the second quarter of 2026, according to the New York Fed. Outside mortgages, the largest pieces at the end of March 2026 were auto loans ($1.69 trillion), student loans ($1.66 trillion) and credit cards ($1.25 trillion).
Car payments are one of the heaviest monthly commitments. According to Experian, the average monthly payment was $765 for a new car and $542 for a used car in the second quarter of 2026, with average loan terms close to six years.
One encouraging sign from Ramsey’s data: reliance on credit cards has edged down, with 39% of Americans using them to get by, compared with 42% in 2021.
7. Debt makes everything else harder
Debt is closely linked to financial stress. Ramsey’s 2026 figures show the pattern clearly:
- Daily worry: 53% of Americans worry about money every day, up from 44% in 2021.
- Struggling with bills: 48% find it hard to pay monthly bills.
- Paycheck to paycheck: 54% live paycheck to paycheck.
- Relationship status matters: 45% of single Americans say they are struggling, compared with 22% of married couples.
Paying down high-interest debt is one of the most reliable ways to improve a household’s finances, although it is easier said than done when bills already absorb most of the income.
Financial education statistics
8. Financial literacy in the US has fallen to its lowest level in a decade
The 2026 TIAA Institute-GFLEC Personal Finance Index, which has tracked US financial literacy for ten years, found that Americans answered only 47% of its 28 questions correctly, the lowest result in the survey’s history. The share of adults with very low financial literacy rose from 20% in 2017 to 25% in 2026, and Gen Z scored lowest, at 38%.
It matters because literacy is linked to outcomes: the same index found that adults with very low financial literacy are twice as likely to be debt-constrained and three times more likely to be financially fragile as those with very high literacy.
9. Most adults think parents should teach kids about money, but few do it regularly
In a 2022 CNBC and Momentive survey, 83% of US adults said parents are most responsible for teaching children about personal finance. Yet only 15% of parents talked to their children about household finances more than once a week, 13% once a week and 16% once a month. A further 24% did so less often, and 31% never did.

Money habits have always been passed down inside families, for better or worse. Today there is more information available than ever, but that makes it harder, not easier, to tell good advice from bad.
10. More US states now require a personal finance course in high school
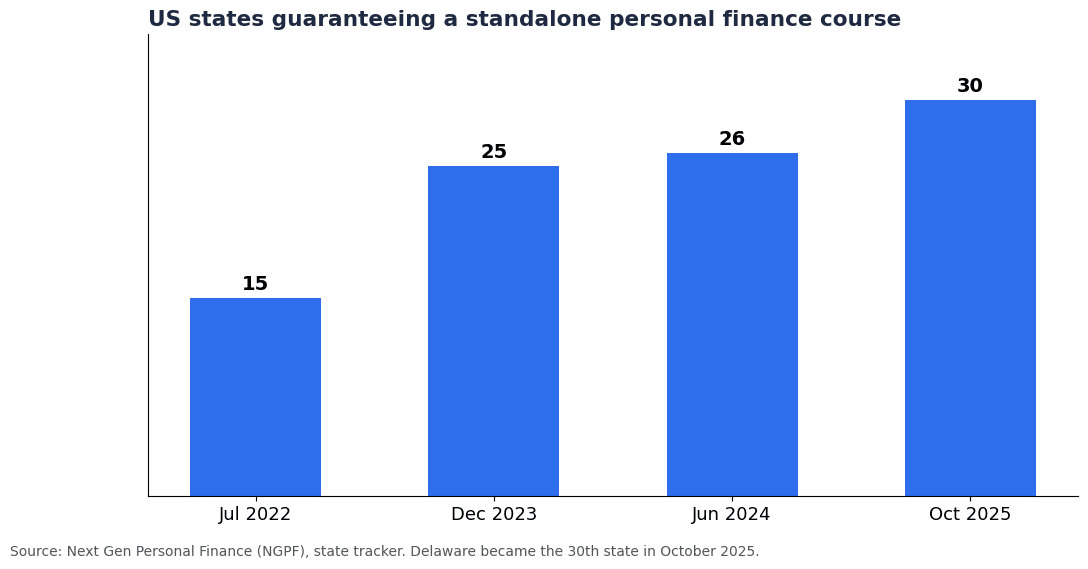
According to Next Gen Personal Finance (NGPF), 30 US states now guarantee a standalone personal finance course before high school graduation, up from 15 in mid-2022. Once every state has rolled out its requirement, 76% of US public high school students (the class of 2031) will be required to take one.
Counting states where personal finance is built into another course, such as economics, the Council for Economic Education puts the number at 39.
Source: Next Gen Personal Finance (NGPF).
Research has found that state mandates for personal finance education led to higher credit scores and lower delinquency rates among the students affected. Support for these mandates is broad, with 88% of adults surveyed in favour.
Net worth statistics
11. The average American household has a net worth of about $1.06 million, but the median is $192,900
Net worth, meaning all assets minus all debts, is probably the best single measure of financial health. According to the Federal Reserve Survey of Consumer Finances (SCF) for 2022, the latest edition published, the average household net worth was $1,063,700, up 23% from 2019.
The median was a much more modest $192,900, up 37%. The gap between the two shows how strongly a small number of very wealthy households pull the average up. The median is the better guide to a typical household.
The SCF runs every three years, and the results of the 2025 survey are due to be published in late 2026.
12. Education is strongly linked to net worth
Education level is one of the clearest dividing lines in the SCF data. Households headed by someone with a high school diploma or some college have a median net worth three to four times higher than those without a high school degree, and a college degree roughly triples it again.

Student debt is the other side of that coin. Americans owed $1.66 trillion in student loans at the end of March 2026, and 10.3% of those balances were 90 or more days delinquent, according to the New York Fed. Delinquencies have risen since reporting of missed federal student loan payments resumed, and about 2.6 million borrowers had loans transferred to the Department of Education’s default unit.
13. Net worth rises with age until retirement
According to the SCF, median net worth rises steadily with age, as income accumulates and investments compound. It is lowest for households under 35 and peaks for those aged 65 to 74, before falling for those over 75 as retirees draw down their savings and face higher healthcare costs.

14. The US is home to 23.6 million millionaires, more than 40% of the world total
According to the UBS Global Wealth Report 2026, the United States has more than 23.6 million dollar millionaires out of roughly 57.5 million worldwide. That is more than the next nine countries combined. Mainland China is a distant second with 5.3 million, followed by Japan with 2.9 million.
The US added more than 440,000 millionaires in 2025 alone, almost half of the global increase. Yet the same report shows the other side: US median wealth per adult was just under $69,000, ranking 28th among the markets UBS covers. A lot of American wealth sits with a relatively small share of people.
Inflation matters here too: a million dollars buys far less than it did a few decades ago, and for many people at the lower end of the millionaire range, most of their wealth is their home.
15. Single women hold less wealth than single men, and couples far more than either
The SCF shows a large wealth gap between single men and single women, especially at younger ages. Single women under 35 had a median net worth of $1,310, compared with $10,110 for single men, and women aged 35 to 54 held just under 35% of the median net worth of men that age ($13,730 vs $39,260).
The gap narrows sharply with age: by 65 and over, single women hold around 90% of the median net worth of single men. Married couples, meanwhile, hold at least twice the net worth of single men and women combined in every age group.

Inflation statistics
Budgeting, saving and managing debt are within your control. Inflation is not, and it has been the dominant force on household finances in recent years.
16. Inflation fell back from its 2022 peak, then picked up again in 2026
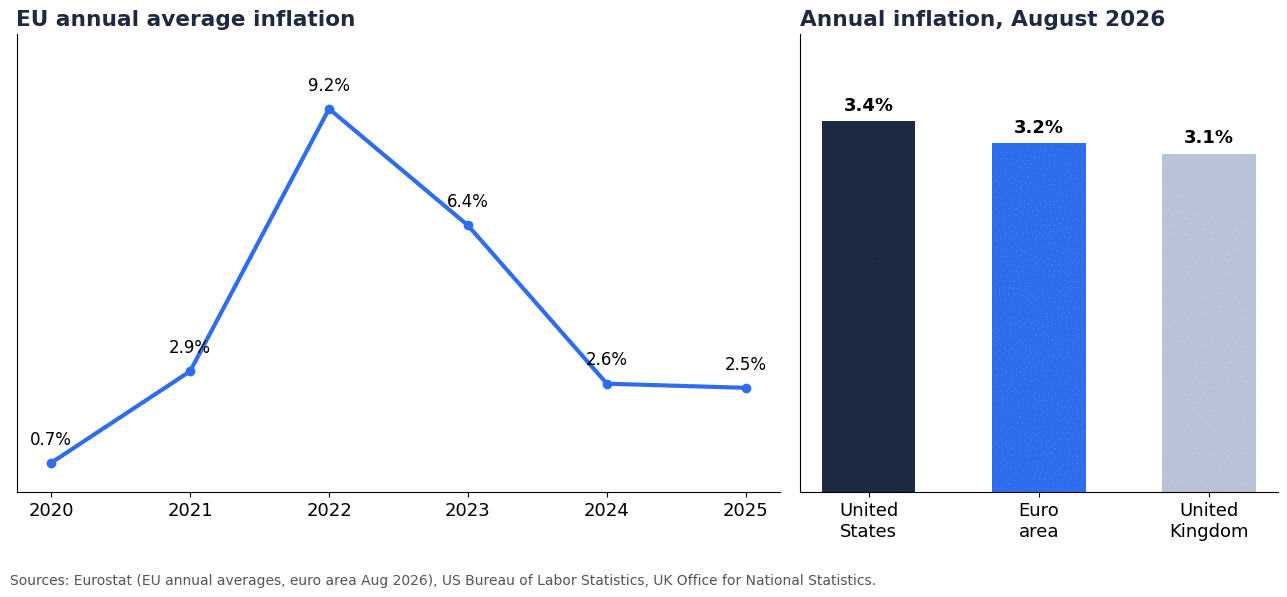
After peaking in 2022, inflation came down steadily through 2023 and 2024. In 2026 it has risen again, driven by a surge in energy prices. In August 2026, annual inflation was:
- United States: 3.4%, with core inflation (excluding food and energy) at 2.4%, its lowest since March 2021 (BLS).
- Euro area: 3.2%, up from 2.9% in July, with energy prices up 14.3% on the year (Eurostat).
- United Kingdom: 3.1% (ONS).
The fact that core inflation is much lower than the headline rate in the US shows how much of the 2026 increase comes from energy rather than from broad price pressure.
Sources: Eurostat, US Bureau of Labor Statistics, UK Office for National Statistics.
17. Three in four Americans say the economy is a significant source of stress
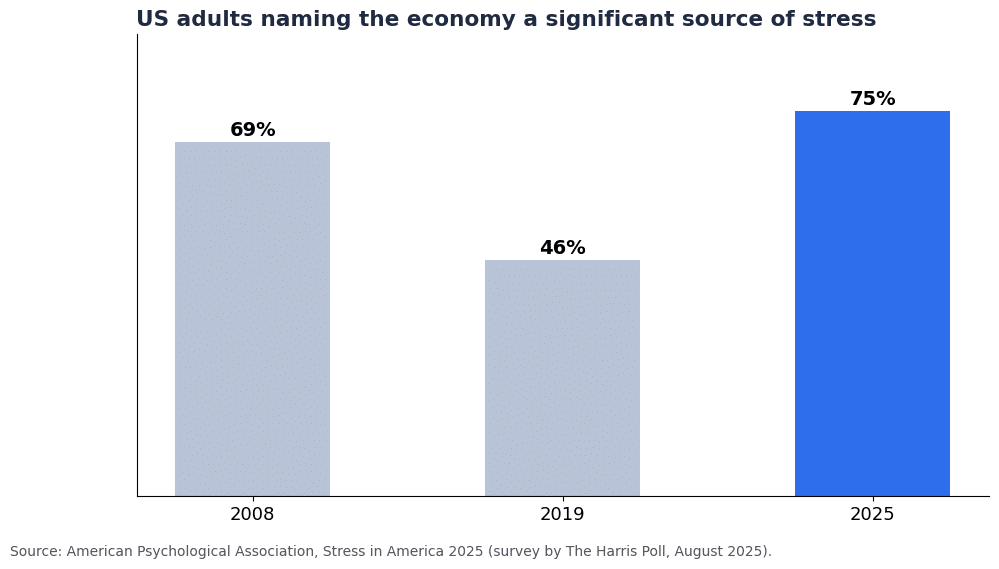
In the American Psychological Association’s Stress in America 2025 survey, 75% of US adults named the economy, including inflation, as a significant source of stress, the highest level in at least 17 years. The share was 69% in 2008, during the financial crisis, and had fallen to 46% by 2019.
Source: American Psychological Association, Stress in America 2025.
Real estate statistics
18. Europeans are more likely to own their home than Americans
68% of people in the EU own their home, according to Eurostat data for 2024. In the United States, the homeownership rate was 65.0% in the second quarter of 2026, according to the Census Bureau, below its long-run average of around 66%.
That runs against the common idea that homeownership is especially American. The EU figure hides big differences, though: ownership ranges from 94% in Romania, 93% in Slovakia and 92% in Hungary to 47% in Germany, the only EU country where more people rent than own.
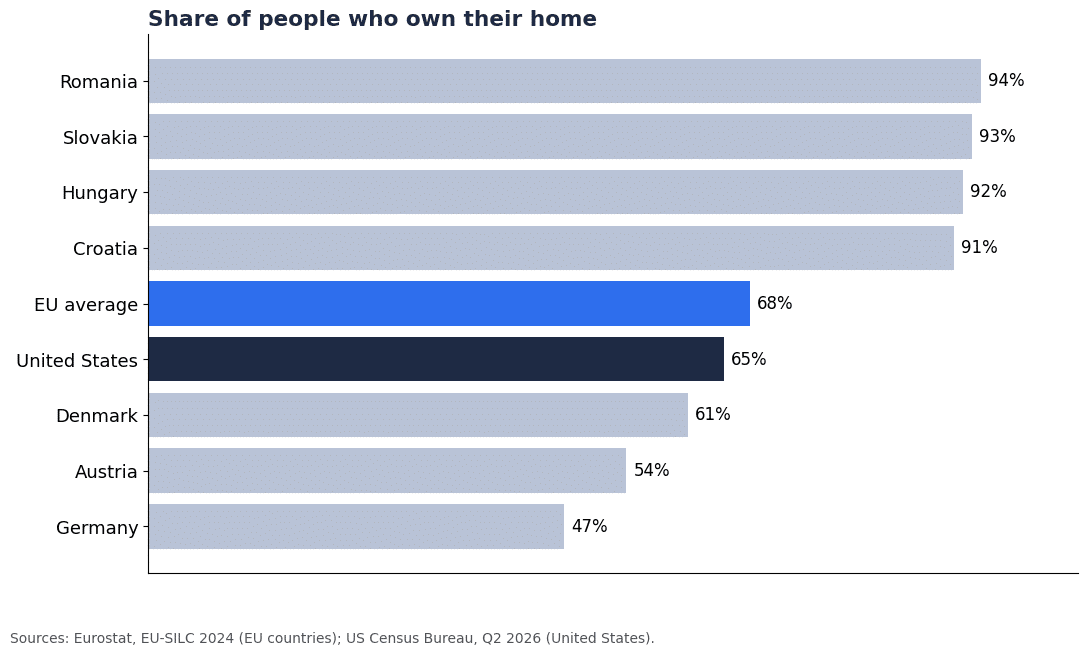
Sources: Eurostat (2024), US Census Bureau (Q2 2026).
19. US home prices have roughly tripled since 2000
According to the S&P CoreLogic Case-Shiller US National Home Price Index, US home prices have roughly tripled since 2000. Combined with higher mortgage rates since 2022, that has made buying a home much harder for first-time buyers.
20. EU house prices are rising again, led by Portugal
After slowing sharply in 2023, European house prices have picked up again. According to Eurostat, house prices in the EU rose 5.1% in the year to the first quarter of 2026, and 4.7% in the euro area, while rents rose 3.0%.
The differences between countries are large. Portugal recorded the highest increase in the EU, at 17.8%, followed by Bulgaria (14.8%) and Slovakia (14.4%). Finland was the only country where prices fell (-2.0%).
Over the longer run, the gap between buying and renting has widened: between 2015 and the third quarter of 2025, EU house prices rose 64.9% while rents rose 21.8%.
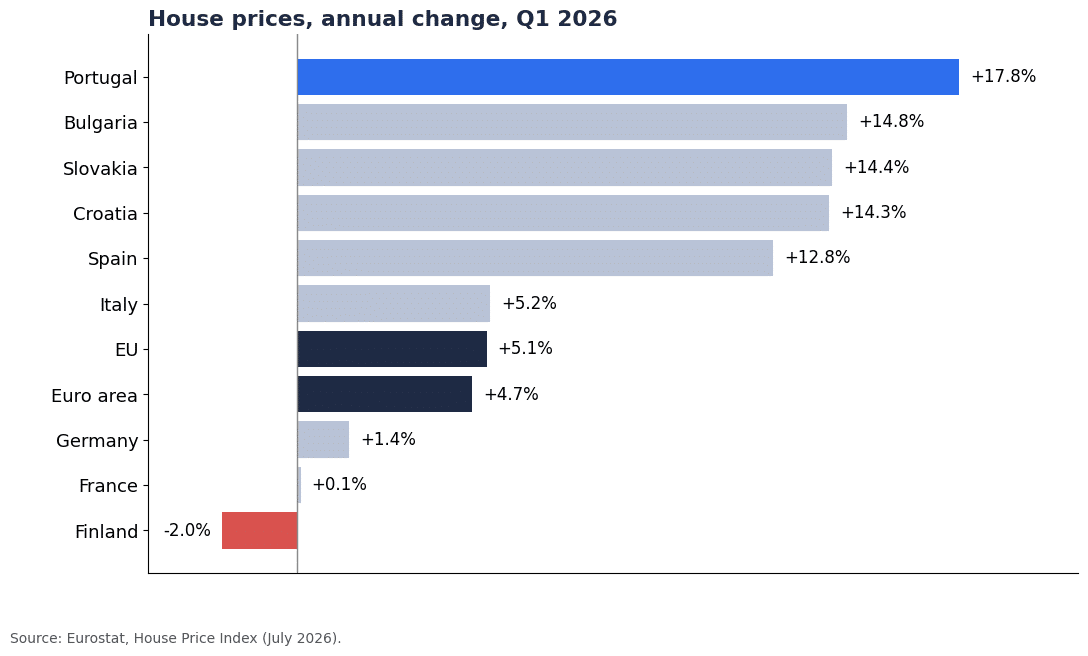
Source: Eurostat, House Price Index.
Income statistics
21. The US leads the UK and EU in income adjusted for the cost of living
Measured by GDP per capita adjusted for purchasing power parity (PPP), which accounts for differences in the cost of living, the US is well ahead of both the UK and the EU average, according to IMF estimates. The IMF’s 2026 projections put the US at $94,430 per person, against $67,957 for the EU average and $67,585 for the UK.
The EU figure hides wide variation. Ireland ($159,129) and Luxembourg ($156,719) rank third and fourth in the world, while Bulgaria ($45,642) sits well below the EU average. Ireland’s figure is inflated by the profits of multinationals based there, so it overstates what a typical Irish household earns.
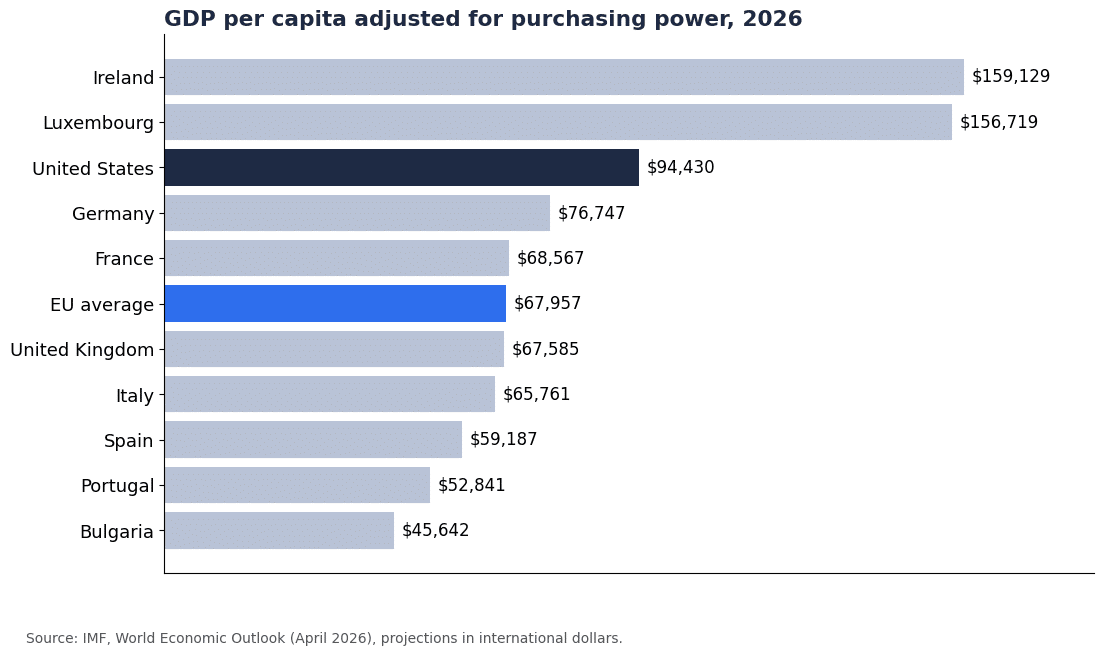
Source: IMF, World Economic Outlook (April 2026).
22. The American middle class has shrunk over the past 50 years
According to Pew Research, the share of American adults in middle-income households fell from 61% in 1971 to 50% in 2021.
Incomes grew for all groups over that period, adjusted for inflation, but not equally: up 69% for upper-income households, 50% for middle-income households and 45% for lower-income households.
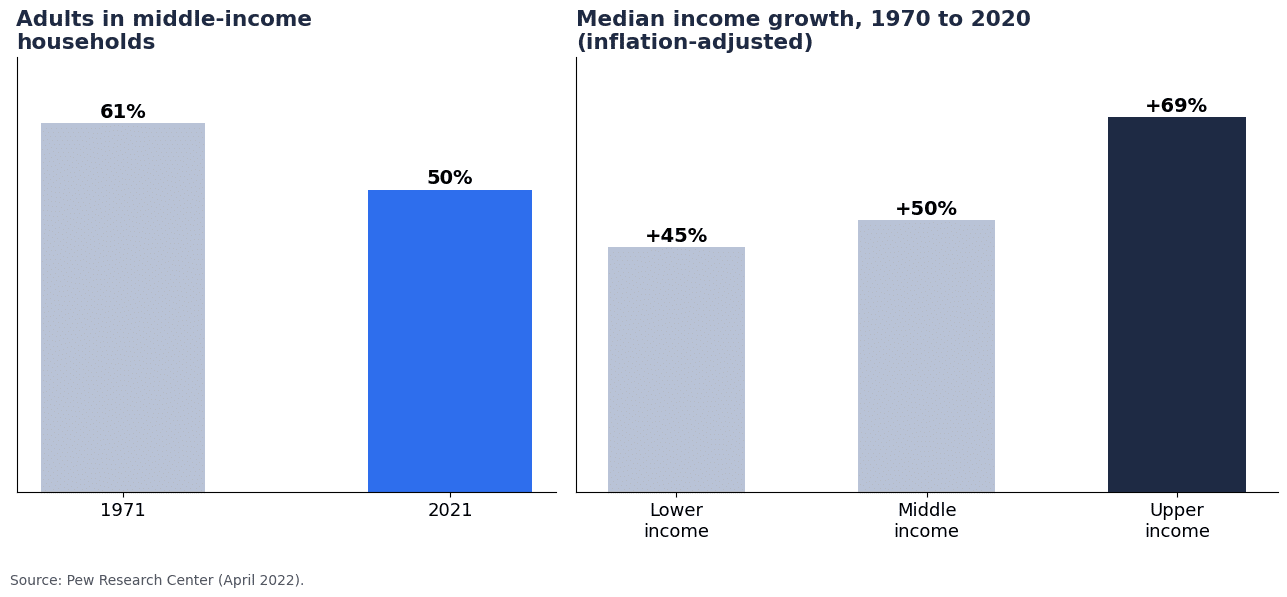
Source: Pew Research Center.
Conclusion
The data tells two stories at once. On one hand, stress is high: a third of Americans describe themselves as struggling, more than half live paycheck to paycheck, and inflation has picked up again in 2026 after falling from its 2022 peak.
On the other hand, the long-term picture is one of growth. Global wealth rose more than 10% in 2025, the number of millionaires keeps climbing, and more people are adopting better habits, with budgeting up and reliance on credit cards down.
The gap between those stories is where personal finance matters most. Median figures, not averages, describe most people’s reality, and the habits that move them are the unglamorous ones: a budget, an emergency fund, paying down expensive debt and investing consistently over time.
Disclaimer: Statistics are taken from the sources linked in each section and reflect the latest figures available when this article was updated in September 2026. This article is for information only and is not financial advice.