Interactive Brokers has been among the most established global brokers since its founding in 1978, and has grown particularly quickly in recent years.
It is known for broad international availability, access to 170+ markets across 36+ countries, advanced trading tools, and consistently low pricing.
That combination has traditionally appealed to intermediate and experienced investors, though the firm has made significant moves toward beginners in recent years, becoming one of the largest brokerages internationally.
In this article we look at the numbers behind Interactive Brokers: client assets, account numbers, revenue, and more, focusing on current data while showing how the key metrics have developed.
Whether you already use the platform, are considering it, or are simply curious, the figures below should give you a clear picture.
Overview
Interactive Brokers was founded in New York in 1978 by Thomas Peterffy, who remains chairman and the largest shareholder. Having emigrated to the United States from Hungary in 1965, Peterffy built the business around applying computer technology to automate trading and reduce costs – an approach that was genuinely novel at the time and remains central to the firm’s low-cost positioning.
Interactive Brokers is headquartered in Greenwich, Connecticut, with around 3,000 employees across offices in North America, Europe, and Asia. Employee count is worth noting alongside its scale: IBKR runs a substantially leaner operation than peers managing comparable assets, which is a direct consequence of its automation-first approach.
The company is regulated by top-tier authorities across multiple jurisdictions and listed on NASDAQ under the ticker IBKR. It joined the S&P 500 in 2024.
For more, read our comprehensive Interactive Brokers review.
Ownership
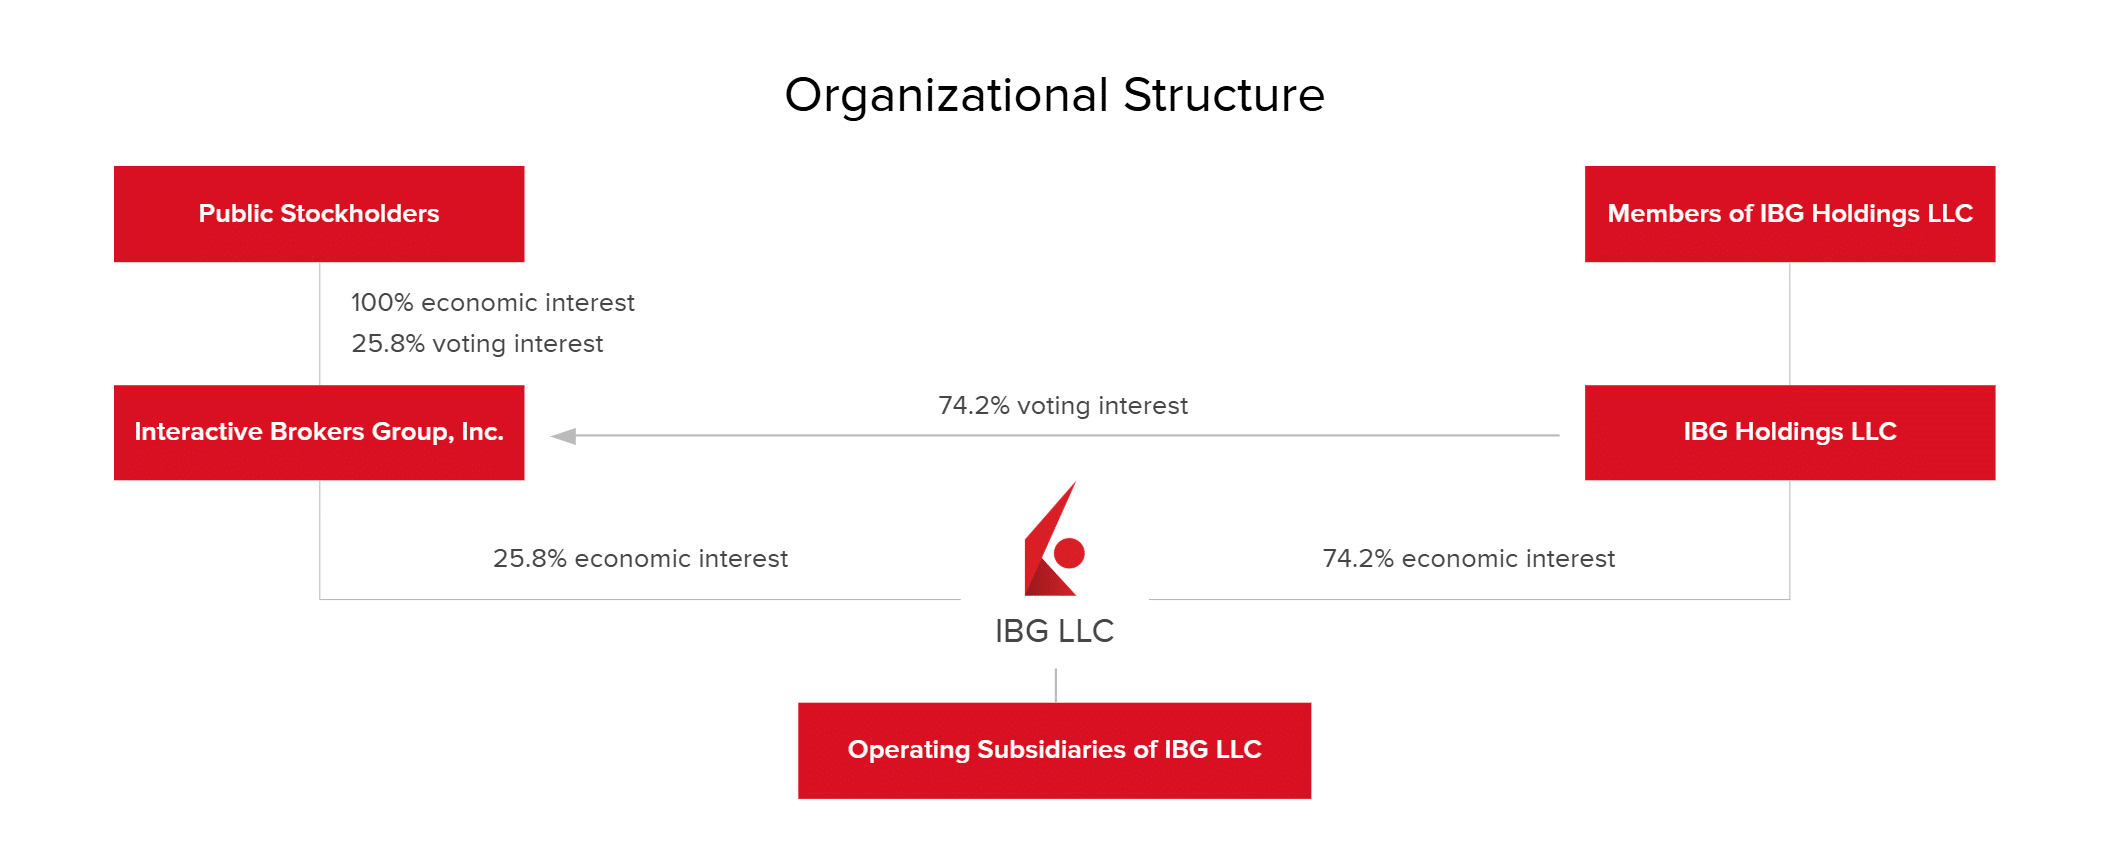
Interactive Brokers is publicly listed, though the ownership structure is unusual. Only a minority of the company trades freely – the majority is held through IBG Holdings LLC by employees and affiliates, with founder Thomas Peterffy the largest individual shareholder by a considerable margin.
This structure means Peterffy retains effective control despite the public listing, which has implications worth understanding: strategic decisions are not subject to the shareholder pressure that shapes most listed brokers, and the firm has been able to prioritise long-term positioning over quarterly results.
Among institutional holders of the publicly traded shares are Vanguard Group, BlackRock, and Orbis Allan Gray, alongside others (source: fintel.io).
Note that IBKR completed a four-for-one stock split in June 2025, so per-share figures from before that date are not directly comparable with current ones.
Interactive Brokers users
As of July 2026, Interactive Brokers serves 5.317 million client accounts, up 34% year-on-year and 3% on the prior month.
Account growth has been consistent and has accelerated markedly in recent years. The client base has more than quintupled since 2020, when IBKR passed the one million mark, and added over 1.3 million accounts in the past twelve months alone.
Several deliberate changes widened the firm’s appeal beyond its traditional professional base. Interactive Brokers removed its monthly inactivity fee, eliminated the minimum deposit requirement, and launched the beginner-oriented IBKR GlobalTrader app with fractional shares from $1. Together these removed the barriers that had historically kept smaller investors away from a platform built for institutions and active traders.
Account numbers alone understate the picture, though. Client equity reached $906.7 billion in July 2026, up 32% year-on-year, meaning IBKR is not simply adding accounts but attracting substantial assets. Average annualised cleared DARTs per account stood at 180, indicating an actively trading client base rather than dormant registrations.
| Year | Customer accounts (thousands) |
| 2006 | 77 |
| 2007 | 95 |
| 2008 | 111 |
| 2009 | 134 |
| 2010 | 158 |
| 2011 | 189 |
| 2012 | 210 |
| 2013 | 239 |
| 2014 | 281 |
| 2015 | 331 |
| 2016 | 385 |
| 2017 | 483 |
| 2018 | 598 |
| 2019 | 690 |
| 2020 | 1,073 |
| 2021 | 1,676 |
| 2022 | 2,091 |
| 2023 | 2,430 |
| 2024 | 3,337 |
| 2025 | 4,400 |
| July 2026 | 5,317 |
Source: Interactive Brokers yearly and monthly reports
Interactive Brokers client assets
With account growth has come a substantial rise in client equity. The trajectory was steady through the 2010s before accelerating sharply from 2020, more than doubling between 2019 and 2021.
2022 was weaker across financial markets, producing a year-on-year decline of nearly 18%. That reversed decisively from 2023 onward, and growth has since accelerated well beyond the previous peak.
As of July 2026, Interactive Brokers holds $906.7 billion in client equity, up 32% year-on-year. Client margin loan balances reached $100.7 billion, up 49%, and client credit balances $180.5 billion.
Note that this is client equity rather than assets under management in the conventional sense. IBKR is an execution and custody broker, not an asset manager – clients direct their own investments, so this figure represents assets held on the platform rather than money IBKR manages discretionarily.
| Year | Client equity (USD billions) |
| 2006 | 6.1 |
| 2007 | 8.8 |
| 2008 | 8.9 |
| 2009 | 15.2 |
| 2010 | 22.1 |
| 2011 | 25.1 |
| 2012 | 32.9 |
| 2013 | 45.7 |
| 2014 | 56.7 |
| 2015 | 67.4 |
| 2016 | 85 |
| 2017 | 125 |
| 2018 | 128 |
| 2019 | 174 |
| 2020 | 289 |
| 2021 | 374 |
| 2022 | 307 |
| 2023 | 426 |
| 2024 | 568 |
| 2025 | 779.9 |
| July 2026 | 906.7 |
Source: Interactive Brokers yearly and monthly reports
Interactive Brokers average account size
As of July 2026, the average Interactive Brokers account holds roughly $170,500, derived by dividing total client equity by the number of accounts.
The figure rose steadily through the 2010s, passing $200,000 for the first time in 2014 and peaking near $269,000 in 2020. It has since settled considerably lower.
That decline reflects composition rather than weakness. IBKR removed its minimum deposit and inactivity fee and launched GlobalTrader, drawing in large numbers of smaller retail accounts. Total client equity has grown strongly throughout – the average simply spreads across many more accounts. A falling average alongside rising total assets is what successful broadening of a client base looks like.
| Year | Average account size (USD thousands) |
| 2006 | 79 |
| 2007 | 92 |
| 2008 | 80 |
| 2009 | 113 |
| 2010 | 139 |
| 2011 | 132 |
| 2012 | 156 |
| 2013 | 191 |
| 2014 | 201 |
| 2015 | 203 |
| 2016 | 220 |
| 2017 | 258 |
| 2018 | 214 |
| 2019 | 252 |
| 2020 | 269 |
| 2021 | 223 |
| 2022 | 146 |
| 2023 | 175 |
| 2024 | 170 |
| 2025 | 177 |
| July 2026 | 170.5 |
Source: Interactive Brokers yearly and monthly reports
Interactive Brokers valuation
Interactive Brokers is listed on NASDAQ under the ticker IBKR and has been a member of the S&P 500 since 2024. The stock has been volatile at times but has delivered strong long-term growth. Note that IBKR completed a four-for-one stock split in June 2025, so per-share figures before that date are not directly comparable with current ones.
As of August 2026, IBKR trades at around $93 per share, giving Interactive Brokers a market capitalisation of roughly $158 billion on a fully diluted basis across all IBG LLC interests.
To put that in perspective against listed competitors:
| Company | Market cap (August 2026) |
| Charles Schwab | $196 billion |
| Interactive Brokers | $158 billion |
| Robinhood | $94 billion |
| IG Group | $6 billion |
Other competitors such as Fidelity Investments, Saxo, and Vanguard are privately held and cannot be compared on this basis. eToro has been publicly listed on NASDAQ since May 2025.
Interactive Brokers revenue
As an execution and custody broker, Interactive Brokers generates revenue principally through commissions on client trades and net interest income – the latter from lending to clients via margin accounts and from investing client cash balances.
Additional revenue comes from other fees and services, including market data, risk exposure fees, and payments for order flow from exchange-mandated programmes.
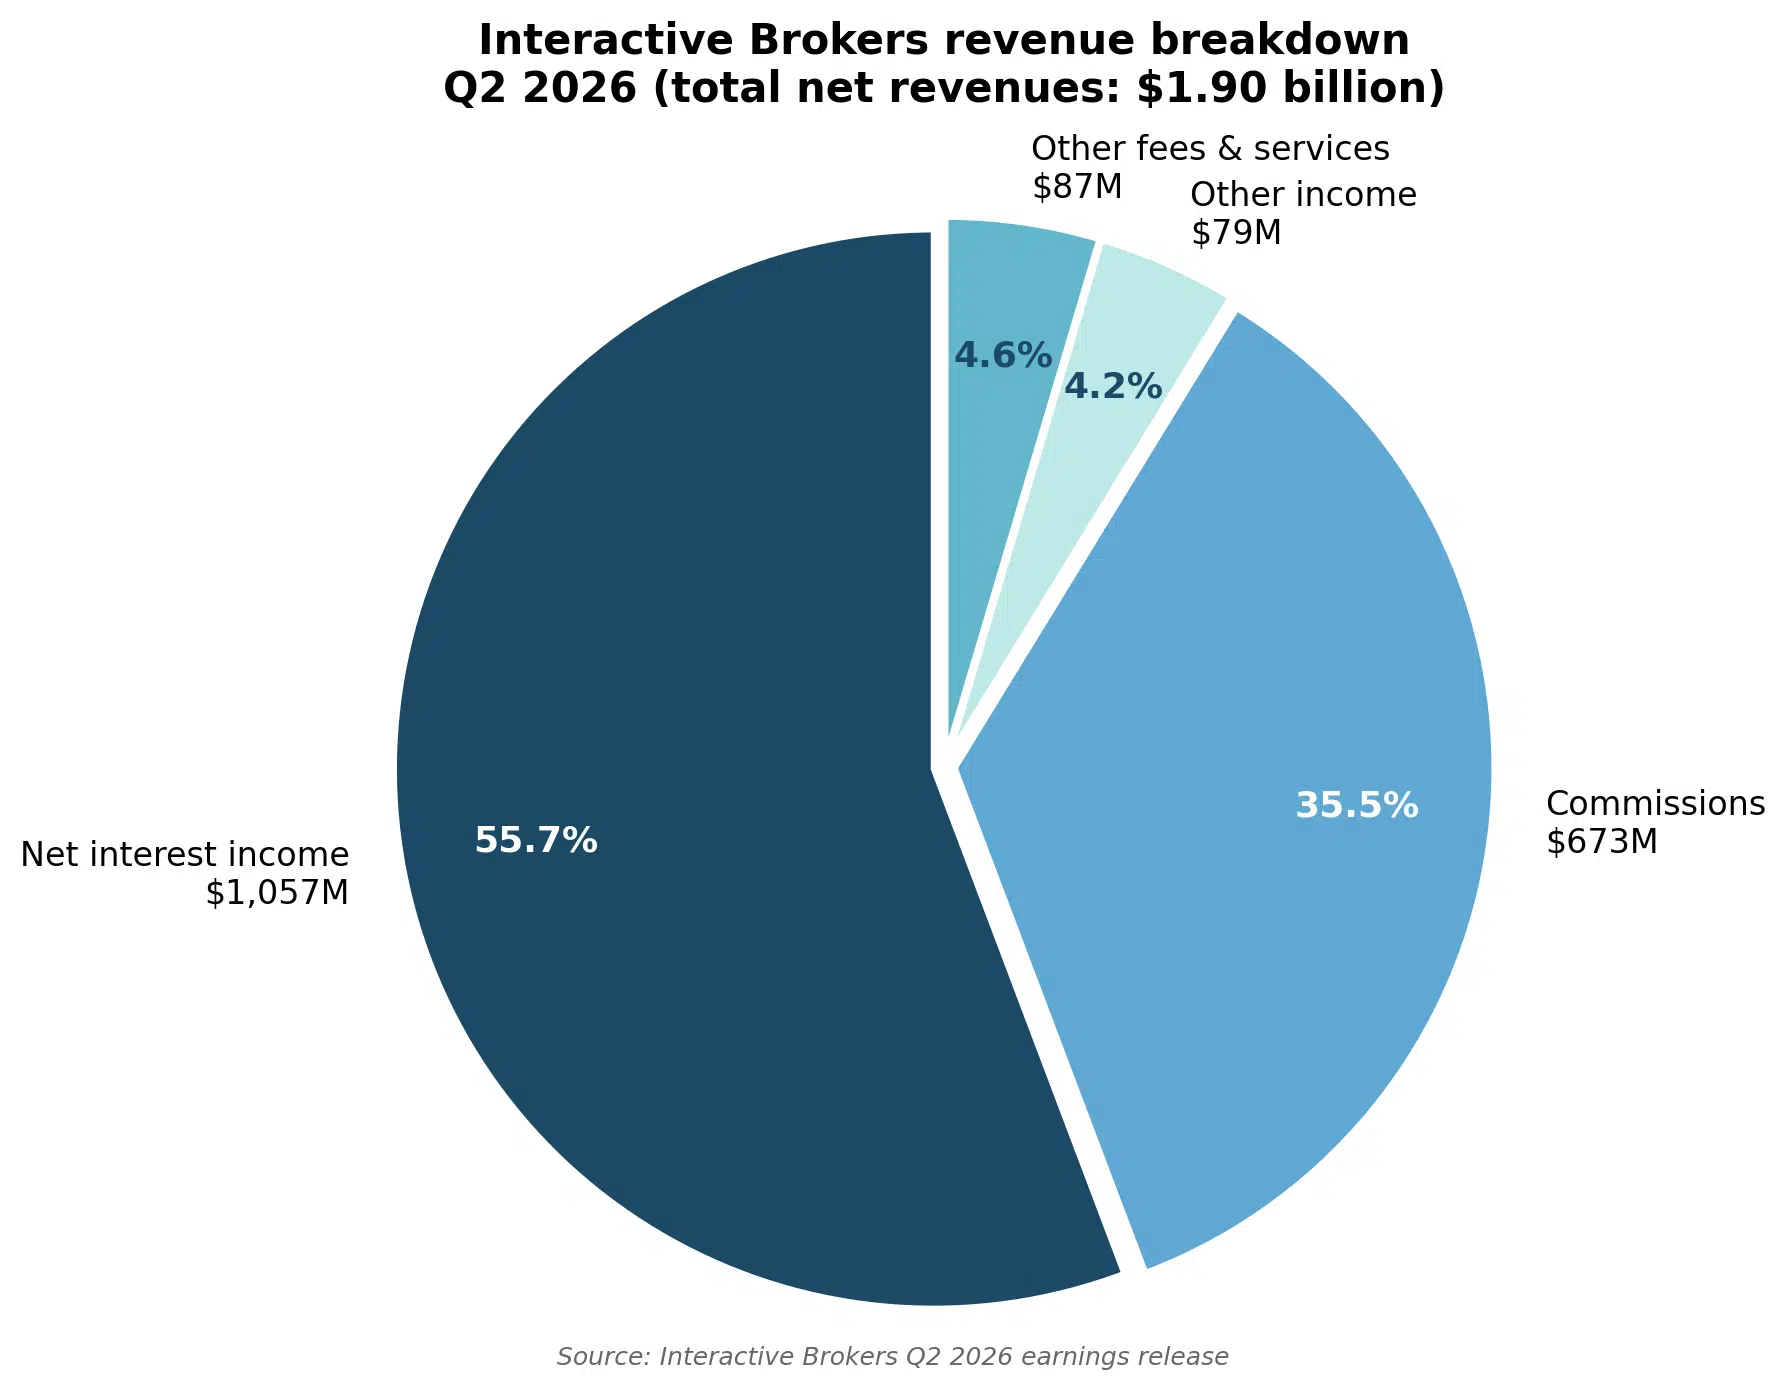
The most recent results, for Q2 2026 (quarter ended 30 June), show:
- Total net revenues: $1.90 billion, up 28% year-on-year;
- Net interest income: $1.06 billion, up 23% on higher margin loans and credit balances;
- Commission revenue: $673 million, up 30% on higher trading volumes;
- Other fees and services: $87 million, up 40%;
- Income before income taxes: $1.46 billion;
- Pre-tax profit margin: 77% (up from 75% a year earlier);
- Diluted EPS: $0.69 (against $0.51 a year earlier);
- Total equity: $22.3 billion.
The 77% pre-tax margin is the number worth pausing on. Very few businesses of any kind operate at that level, and it is the direct result of the automation-first approach IBKR has pursued since 1978 – roughly 3,000 employees supporting 5.3 million accounts and over $900 billion in client equity.
Note also the revenue mix: net interest income exceeds commissions by a wide margin, which means IBKR’s earnings are materially sensitive to interest rate movements. Net interest margin was 1.93% in Q2 2026, down from 2.07% a year earlier as rates eased.
You can access their financial and operating info, including quarterly earnings reports, annual reports, and more, at this link.
Conclusion
Interactive Brokers has established itself as a broker serving the full spectrum from beginners to institutional traders. Removing the barriers that once limited it to professionals – the minimum deposit, the inactivity fee, and the complexity of its main platform – has been the main driver of growth in recent years.
The figures bear that out. Client accounts reached 5.317 million in July 2026, up 34% year-on-year, while client equity grew 32% to $906.7 billion. The business remains exceptionally profitable, with a 77% pre-tax margin in Q2 2026 sustained by an automation-first model that supports millions of accounts with roughly 3,000 employees.
Two things are worth keeping in perspective, though.
- Revenue is rate-sensitive. Net interest income now exceeds commissions by a wide margin, so a sustained fall in interest rates would compress earnings regardless of how many accounts IBKR adds. Net interest margin already narrowed from 2.07% to 1.93% year-on-year in Q2 2026.
- Margin lending has grown quickly. Client margin loans rose 67% year-on-year to $108.5 billion. That drives interest income in rising markets, but leveraged client positions carry credit risk that becomes visible in a sharp downturn – customer bad debt rose from $1 million to $10 million in the same quarter, small in context but worth watching.
None of that undermines the broader picture. Interactive Brokers remains one of the most durable and well-run brokers globally, with growth across accounts, client assets, and revenue all pointing the same way. For investors, the combination of low costs, broad market access, and a transparently reported balance sheet is difficult to match.
FAQs
Is Interactive Brokers safe and regulated?
Interactive Brokers is one of the most reputable global brokers and is regulated by top-tier financial institutions in several countries. These include FINRA, SIPC, SEC, CFTC, IIROC, FCA, CBI, AFSL, SFC, SEBI, MAS, and MNB.
When was Interactive Brokers founded, and by whom?
Interactive Brokers was founded in New York, US, in 1978 by Thomas Peterffy, who is still the company’s chairman and largest shareholder.
In which countries is Interactive Brokers available?
Interactive Brokers is available globally, with some exceptions. You can see the full list of available countries here.
Is there a minimum deposit required to open an Interactive Brokers account?
No, there is no minimum deposit to open an Interactive Brokers account.