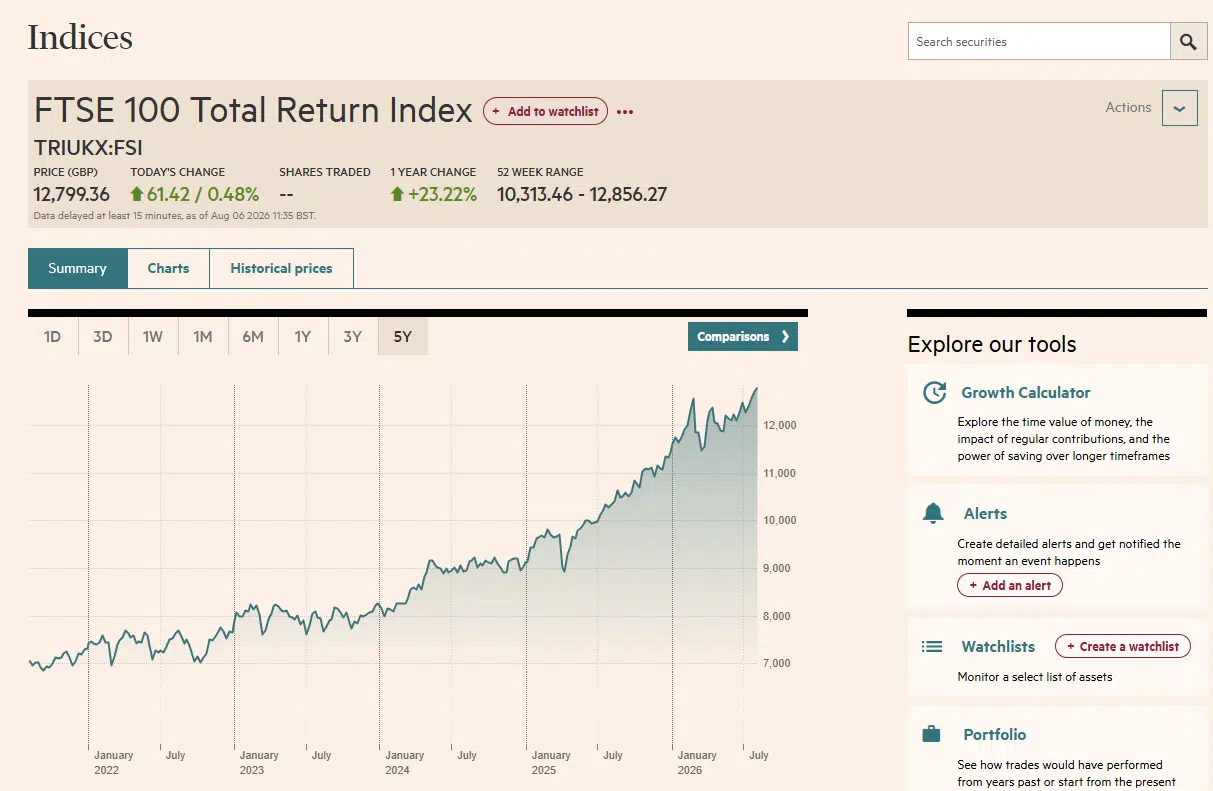
Long dismissed as a laggard, the UK stock market delivered its strongest year since 2009 in 2025, with the FTSE 100 posting a total return of roughly 23% and briefly testing the 10,000-point mark. For the first time in over a decade, the UK’s flagship index outperformed the S&P 500.
That said, headline UK returns have historically looked unimpressive on paper compared with US indices. The main reason for that gap is dividends, which we cover in detail below.
The short version:
- Measured by the FTSE 100 as a proxy for the UK market, the average price return has been roughly 5.6% per year since the index launched in 1984 through to the end of 2025;
- With dividends reinvested, the average total return rises to approximately 7.5% per year over the same period – meaning close to half of all UK equity returns have come from dividends rather than capital growth;
- UK returns lagged other developed markets for much of the past decade, though 2025 marked a sharp reversal, driven by a rotation into energy, mining, and financials as investors moved out of expensive US technology stocks.
Keep reading for a fuller picture of average UK investment returns, what a typical portfolio outcome looks like, and how this compares internationally.
Average investment returns
Before looking at the specifics of UK investment returns, it is worth defining what the term actually covers, since performance can be measured in several different ways.
Put simply, average investment returns refer to the gains made over a given period. Everyone invests to grow their money in one way or another, and average returns are among the clearest ways to assess how an investment has performed historically. It is a useful starting point, though never the whole picture.
The return from any investment can be shaped by factors including:
- Macroeconomic conditions such as interest rates and inflation;
- The quality of a company’s management;
- Underlying financial performance;
- Whether dividends are paid and reinvested;
- Sector and industry competition;
- Geopolitical developments;
- Investor sentiment and confidence.
In short, plenty of direct and indirect factors end up shaping returns, which is why major economic, social, and political events are so often referenced when discussing historical performance.
The UK market illustrates this clearly. The past few years alone have included the inflation shock and rate-hiking cycle of 2022, a prolonged period in which UK equities were dismissed as a “dinosaur index” dominated by slow-growth sectors, and then the sharp reversal of 2025, when the Bank of England’s rate cuts and a rotation out of expensive US technology stocks pushed the FTSE 100 to record highs. An investor’s actual experience depends enormously on which of those periods they were invested through.
This is also why average returns should be treated as a guide rather than a forecast. The long-run figures in this article smooth over calendar years that have ranged from gains above 30% to losses above 30%, and no individual year is likely to resemble the average.
UK stock market and average returns
Before exploring the average investment return of the UK stock market and what that means for UK investors in practice, it is worth briefly explaining how the market is structured.
How the UK stock market is organised
The UK stock market comprises companies listed on British exchanges. The main venues are:
- The London Stock Exchange (LSE) main market, home to the largest listed companies;
- AIM, the LSE’s market for smaller and growth-stage companies, with lighter listing requirements.
A common source of confusion is that when people refer to the “UK stock market”, they are often talking about an index rather than an exchange.
An index is simply a defined list of companies, weighted by a set rule. Using an index makes it far easier to measure performance and average returns consistently over time.
The most widely followed UK indices are:
- FTSE 100: the 100 largest companies by market capitalisation;
- FTSE 250: the next 250 companies, more domestically focused than the FTSE 100;
- FTSE 350: the FTSE 100 and FTSE 250 combined;
- FTSE All-Share: the broadest measure, adding smaller companies to the FTSE 350.
There are other variations, but when people discuss UK market performance they usually mean the FTSE 100, made up of the 100 largest UK-listed firms by market capitalisation.
One point worth understanding about the FTSE 100: despite being the UK’s headline index, it is not really a bet on the British economy. It is dominated by global earners in energy, mining, banking, and pharmaceuticals, with the majority of constituent revenues generated overseas. That makes it track the world economy more closely than the UK high street, and it also means a weaker pound tends to lift the index, since overseas earnings translate into more sterling. Investors wanting genuine UK domestic exposure often look to the FTSE 250 instead, which has historically delivered higher long-run returns with correspondingly larger swings.
The same pattern applies in the US, where the S&P 500 serves as the headline benchmark, working similarly to the FTSE 100 but covering 500 companies.
Both indices give a reasonable read on the health of their respective markets and make it straightforward to track average returns over time.
FTSE 100 performance and returns
Most investors seeking broad exposure to the UK stock market do so through a fund tracking the FTSE 100. Looking at how the index has performed over time therefore gives a reasonable picture of average investment returns for UK investors.
As noted in the introduction, measuring FTSE 100 returns requires care, because dividends account for such a large share of the total. There are two ways to look at performance:
- Price return: how much the index level itself has risen over time. This is the number quoted on the news each evening;
- Total return: a fairer measure, because it includes dividends reinvested along the way.
The FTSE 100 launched on 3 January 1984 with a base level of 1,000. By the end of 2025, following a year in which the index gained roughly 23% on a total return basis and briefly tested the 10,000-point mark, the cumulative price return since inception was approximately 880%. On an annualised basis over those 42 years, that works out at around 5.6% per year.
Apply the same period but include reinvested dividends and the picture changes substantially. The cumulative total return exceeds 2,200%, equivalent to roughly 7.5% per year.
That gap is the single most important thing to understand about UK equities. With the FTSE 100’s dividend yield running at around 3.5%, close to half of all returns from UK shares have historically come from dividends rather than share price growth. An investor who spent their dividends rather than reinvesting them would have ended up with a dramatically smaller portfolio, which is why headline UK performance looks so much weaker than the reality for a long-term holder.
A concrete illustration: an investor who bought the FTSE 100 at the end of 1999, close to the worst possible entry point ahead of the dot-com crash, saw the index level rise barely 600 points over the following two decades. Yet with dividends reinvested, £1,000 invested at that moment still more than doubled to around £2,222.
Here is how a £1,000 investment in the FTSE 100 would have performed from 1999 to 2019, with and without reinvested dividends:

Typical investment returns for UK investors
Drawing on the historic FTSE 100 figures above, we can build a reasonable picture of what a typical UK investor might have experienced.
The single biggest variable is timing – when exactly someone invested. But based on the long-run price return and total return of the FTSE 100, here is how a £10,000 investment would grow over different holding periods at those average annualised rates.
Average UK stock market investment returns
| Years | Value of a £10,000 FTSE 100 investment | |
| Average price return (5.6%) | Average total return (7.5%) | |
| 1 year | £10,560 | £10,750 |
| 2 years | £11,151 | £11,556 |
| 5 years | £13,132 | £14,356 |
| 10 years | £17,244 | £20,610 |
| 15 years | £22,644 | £29,589 |
| 20 years | £29,736 | £42,479 |
| 25 years | £39,048 | £60,983 |
| 30 years | £51,276 | £87,550 |
| 40 years | £88,421 | £180,442 |
Figures assume a constant annualised return and no fees, taxes, or additional contributions. Actual returns vary considerably year to year. Past performance is not a reliable indicator of future results.
The gap between the two columns is where the real lesson sits. After one year, reinvesting dividends is worth less than £200 on a £10,000 investment – barely noticeable. After 40 years, the same decision is worth over £92,000, more than doubling the final outcome.
That is compounding at work, and it explains why the distinction between price return and total return matters so much for UK equities specifically. Given the FTSE 100’s dividend yield of around 3.5%, an investor who takes the income as cash rather than reinvesting it is forgoing roughly half of the market’s long-run return.
Two practical implications for UK investors. First, if you are investing for growth rather than income, choose an accumulating fund share class, which reinvests dividends automatically inside the fund and removes the risk of cash sitting idle. Second, hold these investments within a Stocks and Shares ISA where possible: outside a tax wrapper, dividends above the annual allowance are taxable each year, which drags directly on the compounding shown in the table above.
Boosting average investment returns for UK investors
The UK stock market can deliver reasonable returns, but restricting yourself to it narrows your options considerably.
Many economies outside the UK have grown strongly over the decades, and a UK-only portfolio misses that entirely.
The most obvious comparison is the US. The FTSE 100 has delivered an annualised total return of roughly 7.5% since 1984, while the S&P 500 has returned around 10.15% annualised over a longer period stretching back to 1957.
Over long holding periods, a gap of a few percentage points compounds into an enormous difference. Here is how £10,000 would grow over 40 years at each of those average rates:
- FTSE 100 (7.5%) – £180,442;
- S&P 500 (10.15%) – £477,947.
Three caveats are worth applying to that comparison, though.
First, the periods are not the same. The S&P 500 figure covers 1957 onwards, the FTSE 100 only 1984 onwards, so this is not a like-for-like measurement.
Second, currency. The S&P 500 is denominated in USD, so a UK investor’s returns depend on the GBP/USD rate as well as the index itself. Sterling weakness flatters US returns for UK investors, and sterling strength does the opposite. Over the past decade currency has generally worked in UK investors’ favour, but there is no guarantee that continues.
Third, and most importantly, past outperformance is not a forecast. 2025 demonstrated that neatly: the FTSE 100 outperformed the S&P 500 for the first time in over a decade, as investors rotated out of expensive US technology stocks and into the energy, mining, and banking names that dominate the UK index. Extrapolating the last 40 years into the next 40 is exactly the error the table above invites.
The US is also not the only option. Accessing international markets has never been easier, and global diversification does more than chase higher returns – it spreads risk across economies and currencies, and typically reduces portfolio volatility. For most UK investors, a single fund tracking the MSCI World or FTSE All-World is a more sensible foundation than trying to pick which national market will lead the next decade.
Average return of UK investments compared to global markets
Here is how the UK has performed against benchmarks for other major stock markets, measured over a five-year period in sterling terms.
| Stock market | 5-year return (GBP) | 2025 return (GBP) |
| S&P 500 (US) | +92.04% | +9.41% |
| MSCI Canada | +85.05% | +26.56% |
| FTSE 100 (UK) | +83.19% | +25.63% |
| Nikkei 225 (Japan) | +81.73% | +19.96% |
| DAX 40 (Germany) | +62.93% | +29.16% |
| CAC 40 (France) | +49.29% | +19.92% |
| MSCI China | -7.36% | +21.87% |
Two things stand out. First, no market leads consistently – the ranking above would have looked very different five years ago, and will look different again in five years’ time. Second, the UK’s position illustrates why chasing recent winners is risky: after a decade of being written off, UK equities outperformed the S&P 500 in 2025 as capital rotated out of expensive US technology stocks and into the energy, mining, and financial names that dominate the FTSE 100.
The UK market has not been the strongest performer over most recent periods, but it has not been the weakest either, and it has typically been less volatile than growth-heavy indices. That stability, combined with a dividend yield well above most developed markets, is a large part of its appeal for income-focused investors.
Bottom line on average investment returns in the UK
The UK stock market has delivered solid long-term returns once reinvested dividends are accounted for – roughly 7.5% annualised since 1984, against 5.6% on price alone. That gap is the central lesson of this article: close to half of all UK equity returns have come from dividends, so how you handle income determines a large share of your eventual outcome.
Diversifying beyond the UK still makes sense. A FTSE 100-only portfolio is concentrated in a handful of sectors and around 100 companies, which is a narrow foundation for a multi-decade plan. Adding US exposure through an S&P 500 ETF is the most common route, and the two indices complement each other reasonably well: the US index skews toward growth and technology, while the FTSE 100 is weighted toward mature, dividend-paying businesses.
That said, we would suggest going one step further. Rather than manually combining a UK and a US fund and periodically deciding how much of each to hold, a single fund tracking the MSCI World or FTSE All-World gives you developed-market exposure in one holding, with weightings adjusting automatically as markets shift. It removes the temptation to increase your allocation to whichever market performed best last year, which is where most investors go wrong.
Two final points specific to UK investors:
- Use your tax wrappers: a Stocks and Shares ISA shelters returns from capital gains and dividend tax entirely, and a SIPP adds pension tax relief. Over the timeframes shown in the tables above, the tax saved will likely outweigh any difference between index choices;
- Choose accumulating share classes if you are investing for growth, so dividends are reinvested automatically inside the fund rather than sitting as cash.
Finally, keep in mind that past performance does not dictate future results. 2025 was a useful reminder: the market most investors had spent a decade dismissing turned out to be the one that led. The best investments of the next decade may well not be the winners of the last.