One of the major differences between investing in the US and Europe has been the availability of investing products. Some of the most popular exchange-traded funds (ETFs) in the US are simply not accessible to European investors due to differences in regulation.
In recent years we have seen more and more popular US ETFs coming to European markets. One of the most notable is JP Morgan’s JEPI ETF, with the full name being JPMorgan US Equity Premium Income Active UCITS ETF USD (dist).
What is the JEPI/JEIP ETF, and what is its strategy?
Managed by one of the biggest financial institutions in the world, the JEPI ETF launched on 20 May 2020. It quickly became a popular choice, growing into the largest actively managed equity ETF, with $45.80 billion in assets as of 31 July 2026.
Active management means the fund manager and team are actively buying and selling securities in the fund. One of the most common criticisms of actively managed funds is high fees and underperformance, on average, compared to passive funds that simply follow a predetermined index.
JEPI, however, charges just 0.35% in TER (total expense ratio) for both its US and European versions, which is comparable to many passive funds.
Its strategy is built on generating income while retaining some potential for capital growth. It invests mostly in large-cap US stocks and uses derivatives alongside them: the fund effectively sells covered calls through Equity Linked Notes (ELNs), which produces option premium income and dampens volatility, at the cost of capping how much you participate in a strong rally.
The fund currently yields around 8%. Its 30-day SEC yield stood at 7.88% and its 12-month rolling dividend yield at 8.05% as of 31 July 2026. Being domiciled in Ireland is tax efficient at fund level, since Ireland’s treaty with the USA reduces withholding on US dividends. However, because the ETF distributes its income, it may be less tax efficient in your country of residence than an accumulating ETF that reinvests automatically. Income taxed annually is the trade-off for receiving cash.
JEPI performance and portfolio
Since launch, JEPI has not kept pace with the S&P 500, and the gap is wide. Over the year to 30 June 2026, JEPI returned 7.77% against 22.32% for the index. Over three years it returned 8.99% a year against 20.61%, and over five years 7.47% against 13.41%.
But that comparison alone misses what the fund is designed to do. Here is the calendar year picture:
| Year | JEPI (%) | S&P 500 (%) |
| 2025 | 8.07 | 17.88 |
| 2024 | 12.56 | 25.02 |
| 2023 | 9.88 | 26.29 |
| 2022 | -3.54 | -18.11 |
| 2021 | 21.61 | 28.71 |
Source: JPMorgan Equity Premium Income ETF factsheet, 31 July 2026. Fund returns at NAV. Past performance is not a reliable indicator of future results.
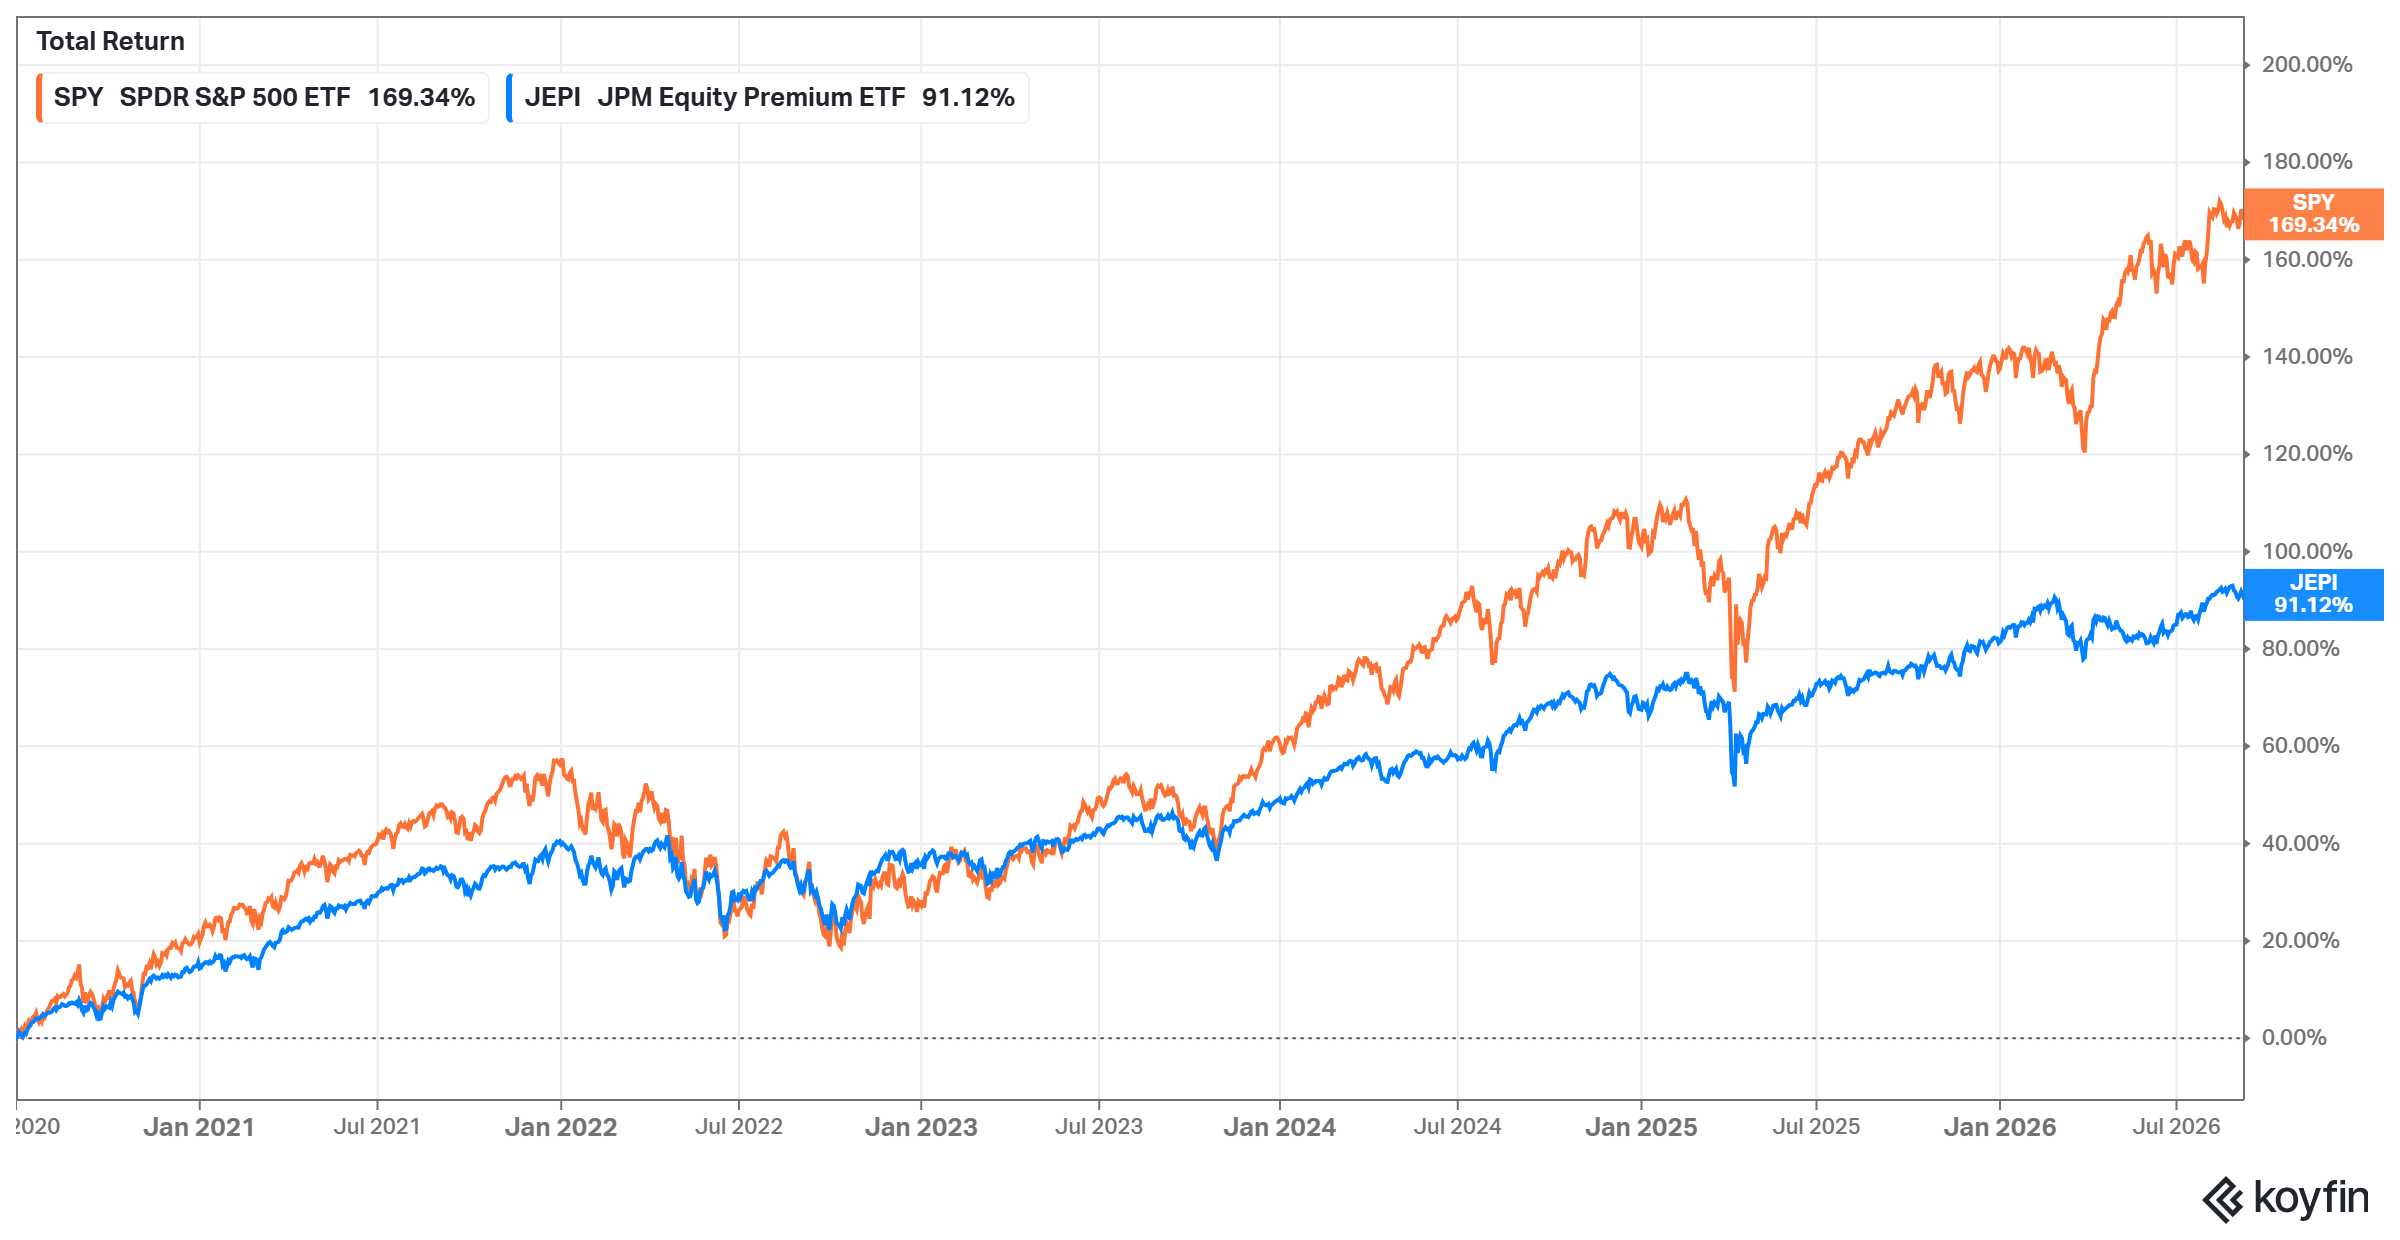
The pattern is consistent and it is the whole point of the strategy. In the four rising years JEPI captured roughly a third to three-quarters of the index return. In 2022, the one falling year, it lost 3.54% while the S&P 500 lost 18.11%.
This relative underperformance in rising markets has been driven by a number of factors, most notably the technology sector, which makes up a large portion of the S&P 500 and delivered several exceptional years. Fees also matter, with JEPI’s 0.35% being significantly more costly than a passive S&P 500 UCITS ETF such as CSPX at 0.07%.
The volatility trade-off
The numbers behind that pattern are worth stating explicitly, because they are the strongest argument for the fund and are easy to miss in a simple return comparison.
As of 31 July 2026, JEPI had a 1-year beta of 0.18 against the market, and a 1-year standard deviation of 7.74 against 13.20 for the S&P 500. In plain terms, it moved far less than the index in both directions. Its portfolio is also valued similarly to the market, at a P/E of 21.07 against 20.35, but is built around smaller companies on average, with a weighted average market cap of $593 billion against $1,398 billion for the index.
That is the exchange being made: you accept a much lower share of a bull market in return for a high monthly income stream and materially less volatility. Whether it is a good exchange depends entirely on what you want the money for. For an investor drawing an income who would struggle to hold through a 20% drawdown, it is a reasonable proposition. For someone accumulating over decades who does not need the cash, giving up that much upside is expensive.
One further cost worth knowing: the fund’s turnover ratio was 172% over the trailing twelve months. High turnover is normal for this strategy but it generates taxable events and trading costs that a passive index fund does not.
Holdings compared
To be more detailed, here is the comparison of the top 10 holdings for both funds (source for JEPI, 31 July 2026; source for CSPX, 31 August 2026):
| JEPI’s top 10 holdings | Weight | CSPX’s top 10 holdings | Weight |
| Amazon.com | 2.0% | Nvidia | 7.93% |
| Microsoft | 1.8% | Apple | 7.06% |
| Alphabet Class A | 1.8% | Microsoft | 5.74% |
| Mastercard | 1.8% | Amazon.com | 3.92% |
| Ross Stores | 1.7% | Alphabet Class A | 3.06% |
| Nvidia | 1.7% | Broadcom | 2.63% |
| Johnson & Johnson | 1.6% | Alphabet Class C | 2.44% |
| EOG Resources | 1.6% | Meta Platforms Class A | 1.91% |
| AbbVie | 1.6% | Micron Technology | 1.58% |
| Trane Technologies | 1.6% | Tesla | 1.48% |
| Total of portfolio | 17.2% | Total of portfolio | 37.75% |
Sources: JPMorgan and iShares factsheets. JEPI top holdings exclude cash and money market instruments.
The concentration difference is stark. CSPX’s ten largest positions account for 37.75% of the fund, more than twice JEPI’s 17.2%, and Nvidia alone is a larger position in CSPX than JEPI’s entire top three combined.
The sector split tells the same story more sharply than is often reported. JEPI holds 15.0% in information technology against 37.56% for CSPX, a gap of more than 22 percentage points. JEPI’s next largest exposures are health care at 12.7%, industrials at 12.1% and consumer discretionary at 11.1%, with financials at 9.9%. Around 14.7% sits in the “other” category, largely the Equity Linked Notes used to generate option income.
The fund holds 129 positions against 504 for the S&P 500 tracker, so it is more concentrated by count but far less concentrated by weight. These ratios change frequently, which is normal for an actively managed fund.
Differences between the US and the EU versions of JEPI
The biggest difference between the US and European versions lies in regulation. European investors do not have access to US-domiciled ETFs and therefore need the strategy to be listed in Europe under UCITS rules.
UCITS stands for Undertakings for Collective Investment in Transferable Securities and is the European Commission’s regulatory framework for managing and selling funds, including ETFs. UCITS funds can be registered and sold throughout the European Union under the same rules and investor protection frameworks. You can find more about UCITS here.
Two practical consequences. The European version is much smaller and newer than its US counterpart, which can mean wider bid-ask spreads. And the figures quoted throughout this article for holdings, yield and volatility come from the US fund’s factsheet, since it has the longer record. The European version follows the same strategy but its portfolio and returns will not be identical.
Pros and cons of the JEPI/JEIP ETF
Pros
-
Issued by one of the most reputable asset managers in the world
-
High income yield, around 8% and paid monthly
-
Materially lower volatility than the S&P 500 (1-year beta of 0.18)
-
Held up far better in the 2022 drawdown, losing 3.54% against the index's 18.11%
-
Low fees for an actively managed ETF
- Much less concentrated than an S&P 500 tracker, with a far smaller technology weighting
Cons
-
Has significantly lagged the S&P 500 in rising markets, which is inherent to the strategy rather than a temporary result
-
The covered call approach structurally caps how much of a rally you capture
-
Five times the cost of a passive S&P 500 UCITS ETF (0.35% versus 0.07%)
-
High portfolio turnover at 172% over the trailing twelve months
-
Distributing structure may be less tax-efficient than an accumulating fund, depending on your tax residency
-
The European version is small and recently launched, so spreads can be wider
- Equity Linked Notes carry liquidity and counterparty risk that a plain equity fund does not
Can you invest in the JEPI/JEIP ETF in Europe, and how?
Yes, the JEPI/JEIP ETF is available to European investors. It is listed under the ticker JEIP on Deutsche Börse (Frankfurt) and the London Stock Exchange, where it trades in EUR and GBX respectively. It is also listed under the ticker JEPI on the London Stock Exchange and the SIX Swiss Exchange, where it trades in USD.
We checked this ETF’s availability on some of the most popular brokerage and fintech platforms available in Europe, and these are the results:


Availability checked in September 2026. Listings and broker coverage change, so confirm with your platform before assuming access.
How to invest in the JEPI/JEIP ETF step-by-step (Interactive Brokers)
We are going to show you how to invest in the JEIP ETF on Interactive Brokers (IBKR). We chose IBKR as one of the most popular and reputable brokerage platforms in the world, including Europe.
Keep in mind that this process may vary depending on the platform you are using. Also make sure you have sufficient funds in your account before the purchase, and note that if your account is in euros and you buy the USD listing, a currency conversion applies.
Step 1: Open your Interactive Brokers account and click “Trade” in the top right corner

Step 2: Type JEIP into the search bar, or JEPI if you want the USD listing. Select the exchange that lists the ETF in your preferred currency.
The same fund trades on several exchanges in different currencies, so this choice matters: picking a listing in your account’s base currency avoids a conversion cost on every purchase.

Step 3: Choose the number of shares or the cash amount, input the quantity, and select the order type.
A limit order lets you set the maximum price you are willing to pay, which is worth using on a smaller or newer listing where spreads can be wider.

Step 4: Preview your order and, if everything looks right, send it by clicking “Transmit Order”
Market orders are usually executed immediately during market opening hours.
That is it, you have bought the JEIP ETF.
Alternatives
JPMorgan has had a similar product in Europe since 30 November 2023, the Global Equity Premium Income Active UCITS ETF. It is listed under the tickers JEPG, JEGP and JGPI on European exchanges and can be bought in USD, GBX and EUR respectively.
Both ETFs follow the same high-yield covered call strategy. The main difference is geography: the global version holds around two-thirds of its portfolio in the US market and spreads the rest across other developed countries. Its TER is the same at 0.35%, and it is considerably larger than the US-only European version, which is to be expected given it has been on the market longer.
If income is not your objective, the more relevant comparison is a plain S&P 500 tracker. CSPX charges 0.07%, holds over $155 billion, and accumulates income rather than distributing it. Over the periods shown above it produced substantially higher returns with substantially higher volatility. Neither is better in the abstract; they answer different questions.
Conclusion
The JEPI ETF has been very popular in the US for good reason. Its high-yield strategy appeals to many investors, but it comes with a clear trade-off rather than a free lunch.
The honest summary is this: you are exchanging a large share of the market’s upside for roughly 8% in monthly income and about half the volatility. Over the past five years, when US equities rose sharply, that exchange cost you a great deal. In 2022 it saved you a great deal. Which matters more depends on whether you are living off the portfolio or building it.
It is good to see European investors getting access to the same products available in the US. JEPI is a reasonable choice for those specifically seeking income and lower volatility, at a fee that is low for active management, provided you go in understanding what you are giving up.