The FTSE All-World and the MSCI ACWI (All Country World Index) are the two best-known indices for investing in the whole world stock market in one go. Both track large and mid-cap companies from developed and emerging markets, but they differ in how many companies they include, how they classify countries and sectors, and which ETFs track them.
You can invest in either index through ETFs and index funds that replicate its performance, getting exposure to thousands of companies with a single investment.
In a nutshell, both indices cover around 90% of the world’s investable stock market and have delivered almost identical returns. The main differences are that the FTSE All-World holds about 4,260 companies versus about 2,460 for the MSCI ACWI, includes a few more smaller companies and countries, and treats South Korea as a developed market.
MSCI ACWI vs FTSE All-World compared in a nutshell
| FTSE All-World | MSCI ACWI | |
| Index launch | 30 June 2000 | 31 May 1990 |
| Markets | Developed and emerging | Developed and emerging |
| Countries | 48 | 47 (23 developed and 24 emerging) |
| Number of constituents | 4,264 | 2,458 |
| Top 5 countries | US, Japan, Taiwan, UK, Canada | US, Japan, Taiwan, UK, Canada |
| Top 5 sectors | Technology, Financials, Industrials, Consumer Discretionary, Health Care | Information Technology, Financials, Industrials, Consumer Discretionary, Health Care |
| Top 5 constituents | Nvidia, Apple, Microsoft, Amazon, Alphabet A | Nvidia, Apple, Microsoft, Amazon, Alphabet A |
| 3-year return (a year) | 21.0% | 21.0% |
| Cheapest large ETF (TER) | Vanguard, 0.14% | SPDR, 0.12% |
Data as at 31 August 2026. Sources: FTSE Russell and MSCI index factsheets. Returns in USD: FTSE All-World total return, MSCI ACWI gross return. ETF data from justETF.
Overview of the FTSE All-World vs MSCI ACWI
The FTSE All-World Index is a market-capitalisation-weighted index* that represents the performance of large and mid-cap stocks from developed and emerging markets around the world. It is part of the FTSE Global Equity Index Series and targets around 90% of the investable market in each region.
The MSCI ACWI is also a market-capitalisation-weighted index of large and mid-cap stocks, covering 23 developed and 24 emerging markets and about 85% of the global investable equity opportunity set.
The main differences between the two indices are:
- Number of companies: the FTSE All-World includes 4,264 companies versus 2,458 in the MSCI ACWI, because it reaches further into mid-sized companies. Its median company is worth about $3.1 billion, against about $10.4 billion in the MSCI ACWI;
- Countries: the FTSE All-World includes Iceland and Romania, which the MSCI ACWI does not, while the MSCI ACWI includes Peru, which the FTSE All-World does not;
- Country classification: FTSE treats South Korea as a developed market, while MSCI still classifies it as an emerging market. This changes the split between developed and emerging markets, but not the total exposure;
- Sector classification: FTSE uses the Industry Classification Benchmark (ICB), while MSCI uses the Global Industry Classification Standard (GICS). For example, Alphabet and Meta count as Technology in the FTSE All-World but as Communication Services in the MSCI ACWI.
* A market-capitalisation-weighted index gives more weight to companies with a larger market value, so the performance of the biggest companies has a greater impact on the index.
Performance
Since both indices hold almost the same companies with very similar weights, their returns are almost identical. According to the official factsheets, as at 31 August 2026:
| Index (USD) | YTD 2026 | 1 year | 3 years (a year) | 5 years (a year) |
| FTSE All-World (total return) | 14.6% | 22.8% | 21.0% | 11.4% |
| MSCI ACWI (gross return) | 14.61% | 22.81% | 21.00% | 11.39% |
Data as at 31 August 2026. Sources: FTSE Russell and MSCI index factsheets. FTSE reports total returns and MSCI reports gross returns, so the figures are not calculated on exactly the same basis.
The chart below compares the annual returns of both indices in US dollars over the last ten full years. Every year, the difference is around 0.3 percentage points or less, sometimes in favour of one index and sometimes the other:
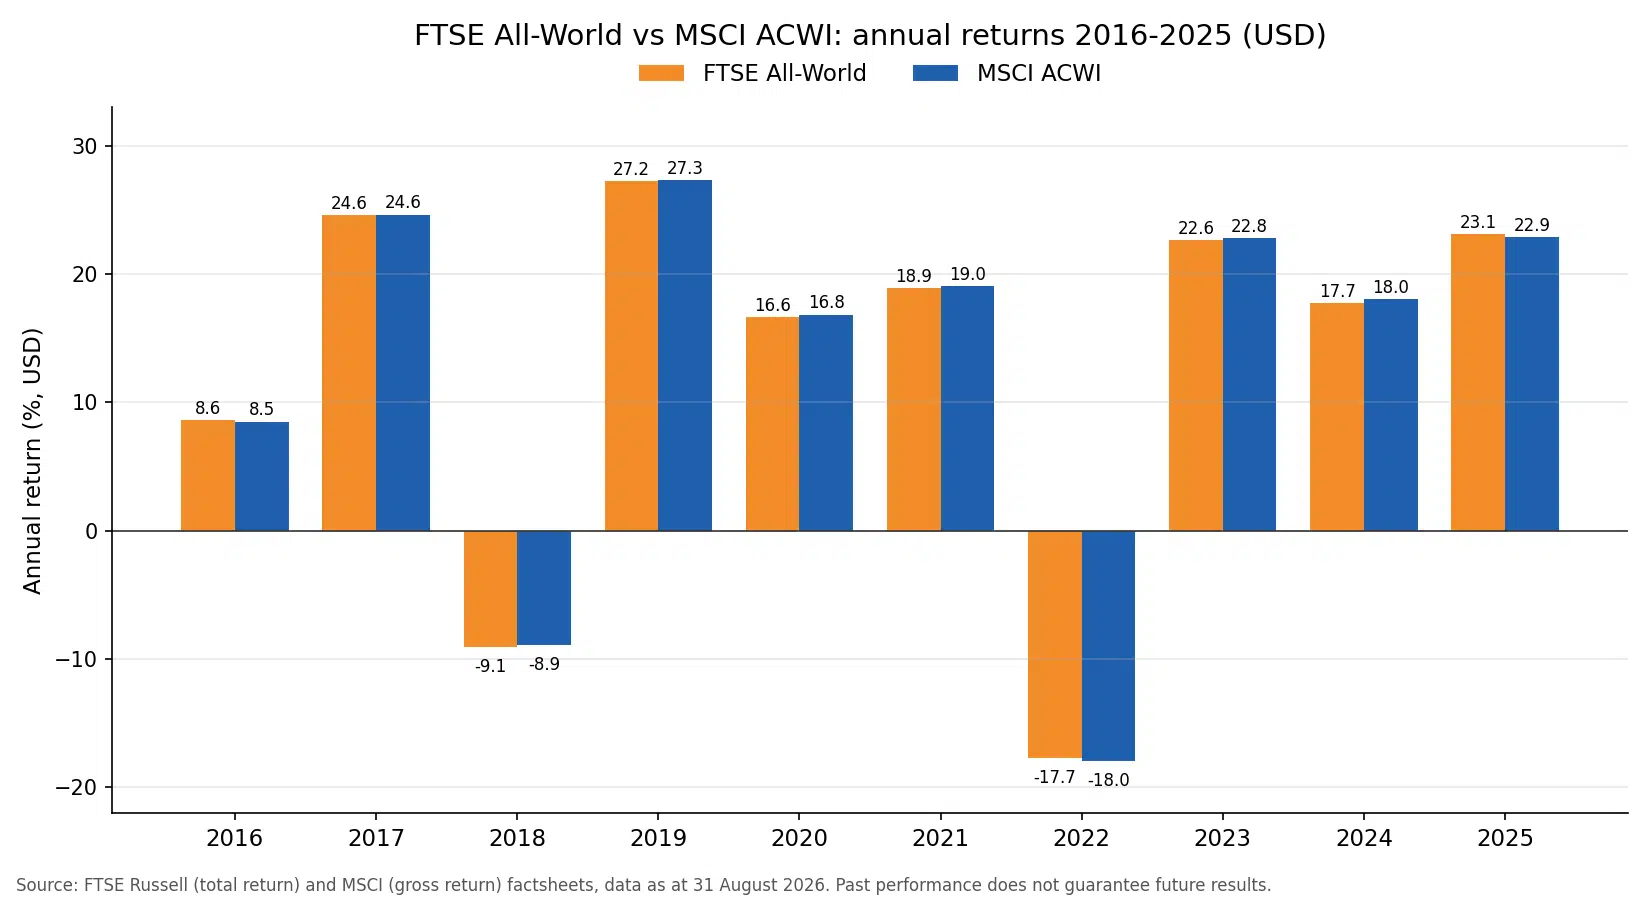
For an investor, the difference in returns between the two indices is so small that it matters less than the ETF’s costs, how well it tracks its index, and whether it is available at your broker.
Country diversification
When it comes to countries, the FTSE All-World and the MSCI ACWI are very similar. Both have the same top five countries, although the weights differ slightly.
| FTSE All-World | MSCI ACWI | ||
| Country | Weight (%) | Country | Weight (%) |
| USA | 61.71% | USA | 63.59% |
| Japan | 5.98% | Japan | 5.09% |
| Taiwan | 3.30% | Taiwan | 3.25% |
| UK | 3.20% | UK | 3.11% |
| Canada | 3.00% | Canada | 3.05% |
| Other | 22.81% | Other | 21.91% |
Data as at 31 August 2026. Sources: FTSE Russell and MSCI index factsheets.
A global portfolio that includes both developed and emerging markets spreads your risk across many economies, and that is exactly what these two indices aim to achieve.
The US accounts for more than 60% of both indices: 61.71% in the FTSE All-World and 63.59% in the MSCI ACWI. The FTSE All-World gives slightly more weight to Japan (5.98% vs 5.09%) and to the rest of the world, partly because it includes more mid-sized companies from outside the US.
The FTSE All-World covers 48 countries, while the MSCI ACWI covers 47. In practice, the few countries that differ (Iceland, Romania and Peru) each represent a tiny fraction of either index, so their impact on returns is minimal.
Sector diversification
| FTSE All-World | MSCI ACWI | ||
| Sector | Weight (%) | Sector | Weight (%) |
| Technology | 34.09% | Information Technology | 31.20% |
| Financials | 15.49% | Financials | 16.95% |
| Industrials | 12.31% | Industrials | 10.59% |
| Consumer Discretionary | 11.04% | Consumer Discretionary | 8.72% |
| Health Care | 7.98% | Health Care | 8.49% |
| Energy | 4.15% | Communication Services | 7.69% |
| Consumer Staples | 3.89% | Consumer Staples | 4.65% |
| Basic Materials | 3.44% | Energy | 4.01% |
| Telecommunications | 3.33% | Materials | 3.80% |
| Utilities | 2.55% | Utilities | 2.33% |
| Real Estate | 1.74% | Real Estate | 1.56% |
Data as at 31 August 2026. Sources: FTSE Russell and MSCI index factsheets.
FTSE All-World: technology is by far the largest sector, at over a third of the index, followed by financials and industrials.
MSCI ACWI: information technology is also the largest sector, followed by financials and industrials.
The technology weight looks higher in the FTSE All-World mainly because of the different classification systems. FTSE’s ICB counts companies such as Alphabet and Meta as technology, while MSCI’s GICS places them in communication services, a sector that doesn’t exist under the same name in ICB.
Technology leads both indices because of strong demand for semiconductors, cloud computing, artificial intelligence and software, which has pushed companies like Nvidia, Microsoft and Broadcom to record valuations. Financials are the second largest sector in both, driven by large banks and insurers.
Number of holdings
The MSCI ACWI captures large and mid-cap companies across 23 developed markets and 24 emerging markets. With 2,458 constituents, it covers approximately 85% of the global investable equity opportunity set.
The FTSE All-World has many more holdings, with 4,264 constituents across 48 countries. It includes large and mid-cap stocks from the FTSE Global Equity Index Series, targeting around 90% of the investable market in each region.
The extra companies in the FTSE All-World are mostly smaller mid-caps, so they add diversification but have little effect on performance. The top 10 holdings represent 23.73% of the FTSE All-World and 24.26% of the MSCI ACWI.
Top 10 holdings
The top 10 holdings of both indices are exactly the same companies, in the same order. Only the weights differ slightly. Micron Technology has joined the top 10 of both indices, replacing Tesla.
| FTSE All-World | MSCI ACWI | ||
| Stock | Weight (%) | Stock | Weight (%) |
| Nvidia | 4.79% | Nvidia | 4.90% |
| Apple | 4.26% | Apple | 4.47% |
| Microsoft | 3.51% | Microsoft | 3.44% |
| Amazon.com | 2.35% | Amazon.com | 2.42% |
| Alphabet Class A | 1.84% | Alphabet Class A | 1.90% |
| Taiwan Semiconductor (TSMC) | 1.72% | Taiwan Semiconductor (TSMC) | 1.80% |
| Broadcom | 1.60% | Broadcom | 1.60% |
| Alphabet Class C | 1.48% | Alphabet Class C | 1.49% |
| Meta Platforms | 1.17% | Meta Platforms Class A | 1.21% |
| Micron Technology | 1.01% | Micron Technology | 1.04% |
Data as at 31 August 2026. Sources: FTSE Russell and MSCI index factsheets.
Availability of ETFs
As you may already know, you cannot buy an index directly. You need to buy a fund that tracks it, such as an exchange-traded fund (ETF) or an index fund.
Our team has compiled the main ETFs tracking each index that are available on European exchanges such as Xetra, Borsa Italiana, Euronext and the London Stock Exchange.
FTSE All-World
| Name | ISIN | Ticker* | TER | Fund size | Replication | Income |
| Vanguard FTSE All-World UCITS ETF (USD) Accumulating | IE00BK5BQT80 | VWCE | 0.14% | EUR 45.3 bn | Physical (sampling) | Accumulating |
| Vanguard FTSE All-World UCITS ETF (USD) Distributing | IE00B3RBWM25 | VWRL | 0.14% | EUR 22.4 bn | Physical (sampling) | Distributing |
| Invesco FTSE All-World UCITS ETF Acc | IE000716YHJ7 | FWRA | 0.15% | EUR 3.7 bn | Physical (sampling) | Accumulating |
| Invesco FTSE All-World UCITS ETF Dist | IE0000QLH0G6 | FTWG | 0.15% | EUR 274 m | Physical (sampling) | Distributing |
Fund size and TER as of August 2026. Source: justETF. *Tickers refer to one of the main listings (Xetra or Borsa Italiana), except FTWG, which refers to the London Stock Exchange. The same ETFs trade on other European exchanges under different tickers. Newer, cheaper FTSE All-World ETFs have also launched, but they are still much smaller.
MSCI ACWI
| Name | ISIN | Ticker* | TER | Fund size | Replication | Income |
| iShares MSCI ACWI UCITS ETF USD (Acc) | IE00B6R52259 | IUSQ | 0.20% | EUR 29.6 bn | Physical (sampling) | Accumulating |
| State Street SPDR MSCI All Country World UCITS ETF (Acc) | IE00B44Z5B48 | SPYY | 0.12% | EUR 14.7 bn | Physical (sampling) | Accumulating |
| Amundi MSCI All Country World UCITS ETF EUR Acc | LU1829220216 | ACWI | 0.45% | EUR 2.3 bn | Synthetic (swap) | Accumulating |
Fund size and TER as of July 2026. Source: justETF. *Tickers refer to one of the main listings (Xetra or Borsa Italiana). The same ETFs trade on other European exchanges under different tickers. Smaller alternatives include the Scalable MSCI AC World Xtrackers UCITS ETF (TER 0.15%) and BNP Paribas Easy MSCI ACWI UCITS ETFs (TER 0.06%).
A few things to keep in mind when choosing between these ETFs:
- Costs: Vanguard cut the TER of its FTSE All-World ETFs to 0.14%, and SPDR’s MSCI ACWI ETF costs just 0.12%, cheaper than iShares’ 0.20%;
- Size: VWCE and IUSQ are the largest global ETFs of their kind in Europe, which usually means tight spreads and a very low risk of closure;
- Replication: the Amundi ETF is synthetic, meaning it uses a swap to replicate the index instead of holding the shares, and it is also the most expensive of the list.
Cheapest brokers to invest in ETFs
Now that you know the differences between the two indices, it’s time to choose a broker. We evaluated the most important features of European ETF brokers and picked four you should consider:
- eToro: best for social trading and commission-free ETF investing;
- Interactive Brokers: best for the largest ETF offering;
- DEGIRO: best for low-cost ETF trading;
- Trading 212: best for commission-free stock and ETF investing (Other fees may apply. See terms and fees.).
Disclaimer: Investing involves risk of loss. eToro is a multi-asset investment platform. The value of your investments may go up or down. Your capital is at risk. Other fees apply. For more information, visit etoro.com/trading/fees.
| Broker | ETF fees | Minimum deposit | Number of ETFs | Regulators |
| eToro | $0 (other fees apply) | $50 (varies between countries) | 300+ | FCA, CySEC, ASIC |
| Interactive Brokers | Tiered: 0.05% of trade value (min. €1.25, max. €29) | €/$/£0 | 13,000+ | CBI, FCA, SEC, FINRA and others |
| DEGIRO | €1 handling fee on Core Selection ETFs; €3 on other ETFs | €0 | 200+ in the Core Selection | BaFin, AFM and DNB |
| Trading 212 | Commission-free (Other fees may apply. See terms and fees.) | €1 (€10 for bank transfers) | 600+ | FCA, CySEC, BaFin, ASIC |
Fees as of September 2026.
Conclusion
Both the MSCI ACWI and the FTSE All-World offer broad global stock market exposure, covering developed and emerging markets with thousands of companies. Their top holdings, country weights and long-term returns are almost the same.
The FTSE All-World is slightly broader, with around 4,260 companies against 2,460 in the MSCI ACWI, while the MSCI ACWI is the more widely used benchmark among fund managers. In practice, the choice between them usually comes down to the ETF itself: its costs, size, replication method, distribution policy and whether your broker offers it.
Disclaimer: When investing, your capital is at risk and you may get back less than invested. Past performance doesn’t guarantee future results.