With financial markets increasingly global, many investors look for opportunities beyond their home country. When investing through indexes, the right mix of diversification, market exposure and low costs is essential.
The MSCI (originally Morgan Stanley Capital International) indexes are among the most widely used benchmarks for stock markets worldwide. Because they are global, currency movements (for example between the EUR, GBP and USD) can have a significant impact on what you actually earn.
In short, the difference between the two is that MSCI ACWI tracks companies from developed and emerging markets, while MSCI World only tracks companies from developed markets.
MSCI ACWI is the better fit if you want exposure to emerging markets such as China, India or Taiwan. If you prefer to stick to developed markets, MSCI World could be a good fit.
In this article, we’ll explore the differences between the two indexes, how they have performed, which ETFs track them and what currencies mean for your returns.
MSCI ACWI vs MSCI World in a nutshell
We have gathered the key information discussed throughout the article in this table so that you can make an informed decision.
| Index | MSCI ACWI | MSCI World |
| Launch date | May 1990 | March 1986 |
| Markets | Developed and emerging | Developed |
| Countries | 47 (23 developed, 24 emerging) | 23 |
| Constituents | 2,458 | 1,280 |
| Top 5 countries | US, Japan, Taiwan, UK, Canada | US, Japan, UK, Canada, France |
| Top 5 sectors | Information Technology, Financials, Industrials, Consumer Discretionary, Health Care | Information Technology, Financials, Industrials, Health Care, Consumer Discretionary |
| Top 5 constituents | NVIDIA, Apple, Microsoft, Amazon, Alphabet (Class A) | NVIDIA, Apple, Microsoft, Amazon, Alphabet (Class A) |
| 10-year return | 12.58% per year | 13.01% per year |
| Lowest ETF TER | 0.12% | 0.05% |
Index data as of August 31st, 2026 (source: MSCI.com). Returns are annualised net returns in USD. TERs refer to the ETFs listed later in this article.
Overview of the MSCI ACWI vs MSCI World
The MSCI ACWI is the broader index and includes stocks from both developed and emerging markets. On top of the countries covered by MSCI World, it adds 24 emerging markets such as China, India, Taiwan, Korea and Brazil. It gives a fuller picture of global equity markets and the growth opportunities outside the developed world.
The MSCI World covers large and mid-cap stocks from 23 developed countries. Like ACWI, it is weighted by market capitalisation (bigger companies get a bigger weight), which is why US companies carry far more influence than those of any other country.
In practice, the two overlap heavily. MSCI World represents about 88% of ACWI’s market capitalisation, so the emerging markets that make up the difference account for roughly 12% of ACWI.
Based on index market capitalisation of USD 91.7 trillion (MSCI World) and USD 104.0 trillion (MSCI ACWI) as of August 31st, 2026. Source: MSCI.com.
Performance
To compare performance, we use the indexes themselves rather than a specific ETF, since fees and tracking differences vary between providers. The figures below are net returns in US dollars (dividends reinvested after withholding tax), as published by MSCI.
| Period | MSCI ACWI | MSCI World |
| 1 year | 22.35% | 20.37% |
| 3 years (per year) | 20.48% | 20.11% |
| 5 years (per year) | 10.88% | 11.21% |
| 10 years (per year) | 12.58% | 13.01% |
| Since Dec 2000 (per year) | 7.48% | 7.53% |
Data as of August 31st, 2026 | Source: MSCI.com
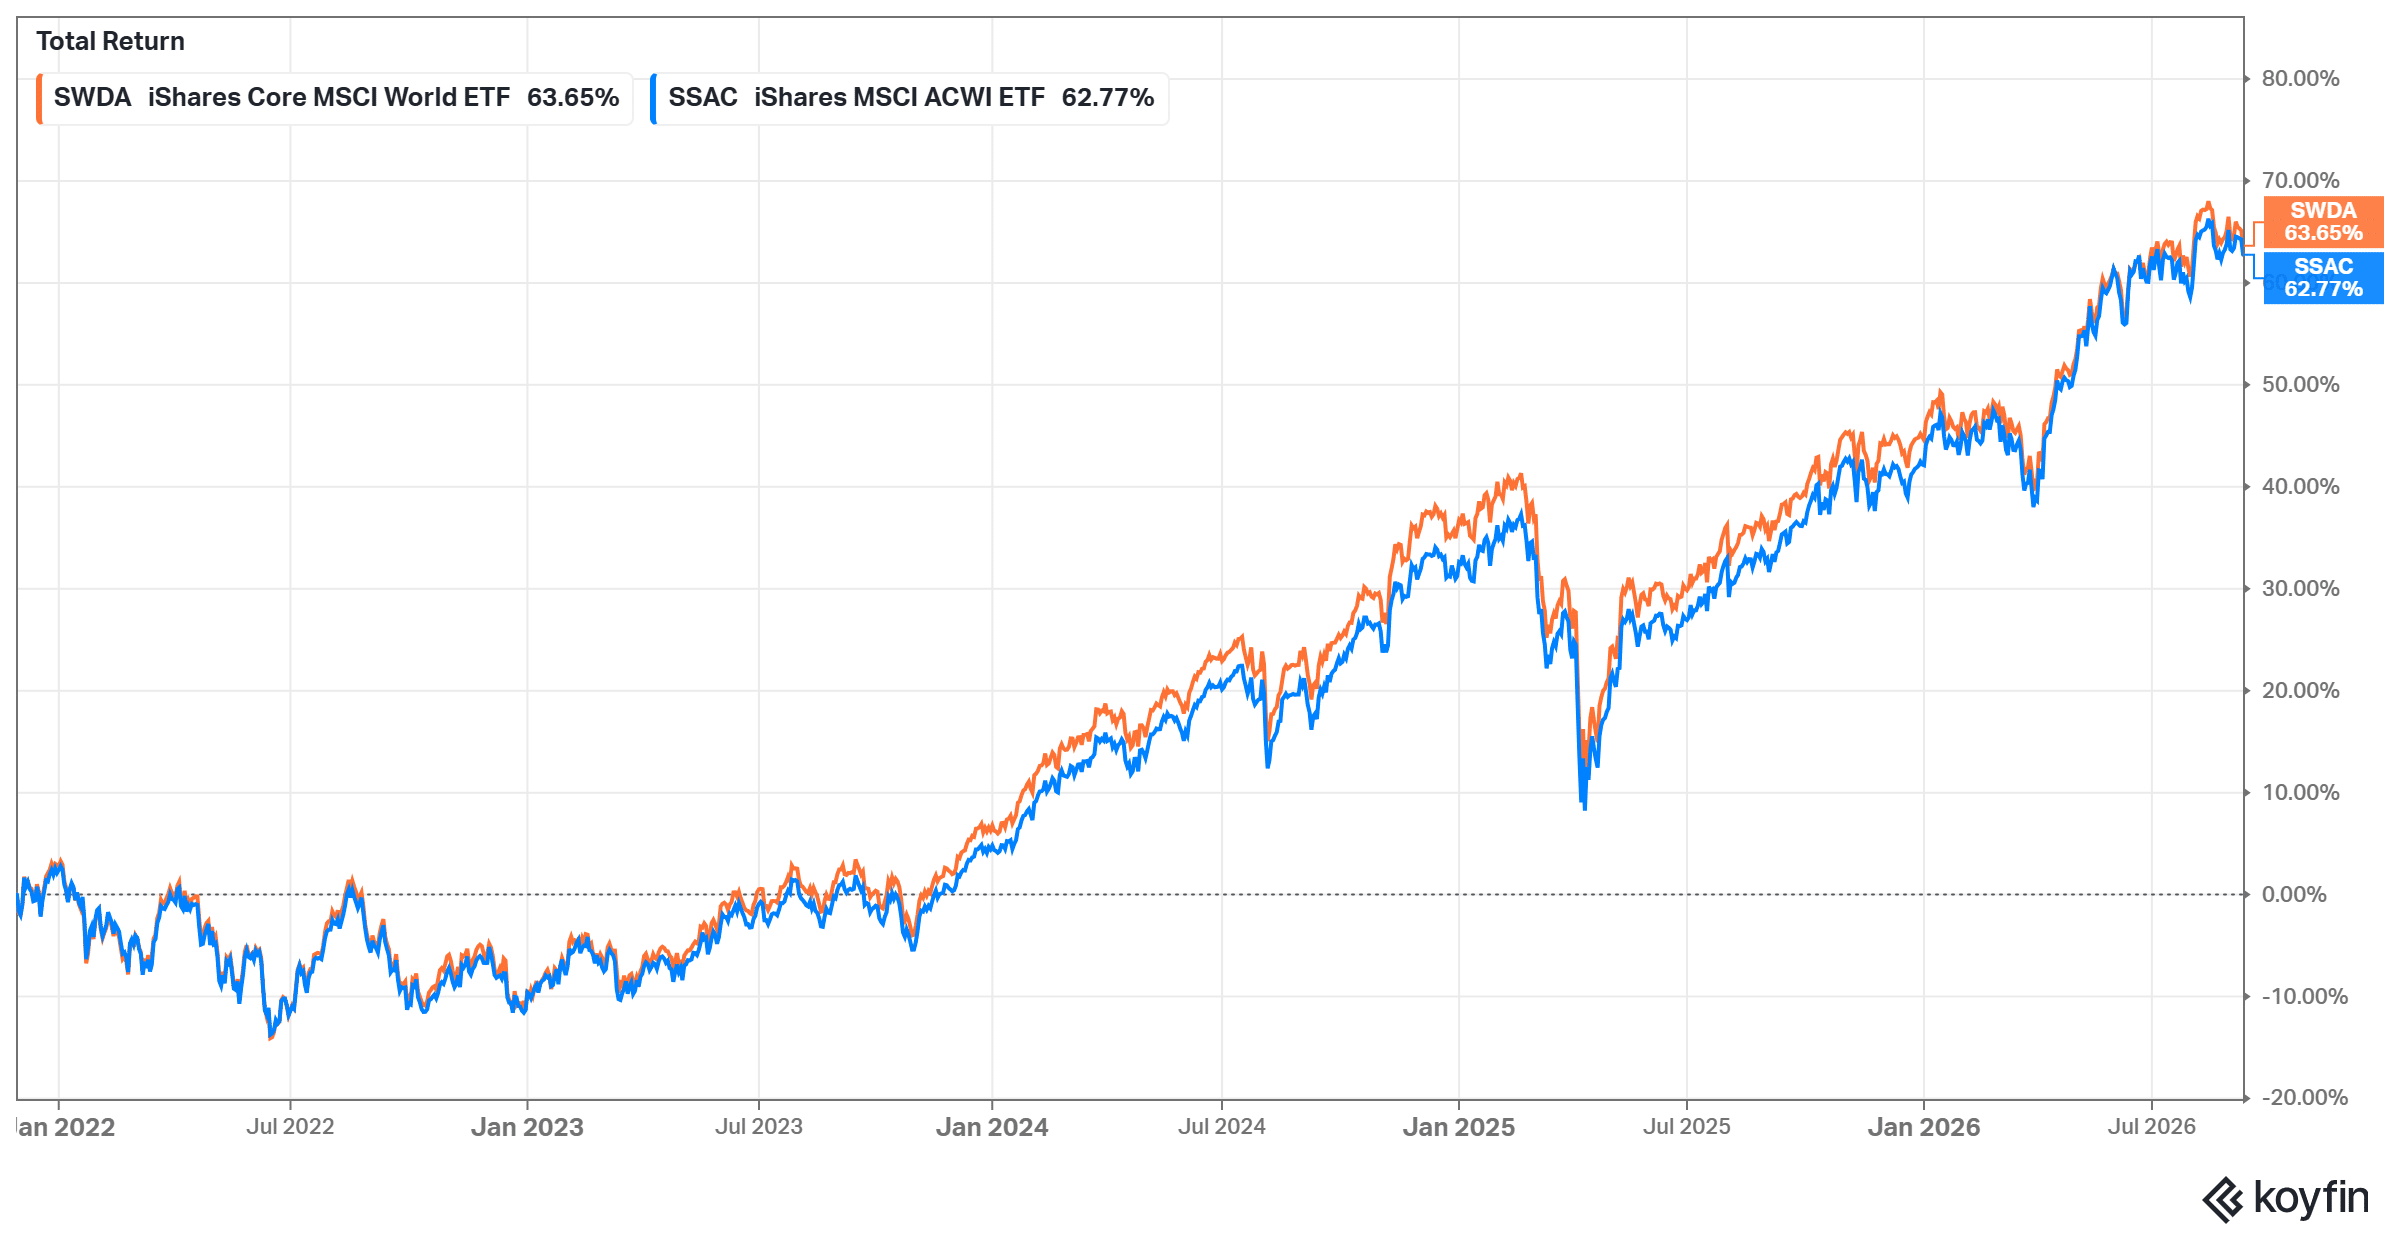
Over the long run, MSCI World has come out ahead. The main reason is that US stocks, which weigh more in MSCI World, beat emerging markets for most of the last 15 years. $100 invested at the end of 2011 would have grown to about $544 in MSCI World by the end of August 2026, against about $502 in MSCI ACWI.
The recent picture is different. Emerging markets rose 33.57% in 2025 and 39.25% in the 12 months to August 2026. As a result, ACWI beat World in 2025 (22.34% vs 21.09%) and over the last one and three years.
In orange, it is possible to observe the evolution of the iShares MSCI ACWI UCITS ETF (SSAC), while in blue, it is possible to observe the trend of the iShares Core MSCI World UCITS ETF USD (SWDA).
Nevertheless, past performance is not indicative of future returns, and there is no guarantee that the same results will persist.
Geographic diversification
When it comes to exposure across countries, the two indexes differ more than their top five lists suggest.
| MSCI ACWI | MSCI World | ||
| Country | Weight | Country | Weight |
| US | 63.59% | US | 72.14% |
| Japan | 5.09% | Japan | 5.78% |
| Taiwan | 3.25% | UK | 3.53% |
| UK | 3.11% | Canada | 3.46% |
| Canada | 3.05% | France | 2.36% |
| Other | 21.91% | Other | 12.74% |
Data as of August 31st, 2026 | Source: MSCI.com
The MSCI ACWI covers 47 countries across developed and emerging markets. That broader coverage explains its much larger “other” slice (21.91% vs 12.74%). Taiwan is now ACWI’s third-largest country, ahead of the UK, and TSMC alone accounts for 1.80% of the index.
The MSCI World covers 23 developed countries and is more concentrated. The US makes up 72.14% of the index, against 63.59% in ACWI. If you want to reduce your dependence on the US market, ACWI helps, but only up to a point: in both indexes, the US is still well over half of the portfolio.
Sector diversification
The sector breakdown of the two indexes is very similar. Information Technology dominates both and now represents around 30% of each. Its weight is slightly higher in ACWI (31.20% vs 29.81%) because emerging markets such as Taiwan and Korea add large semiconductor makers.
Sector allocation for MSCI ACWI:
| Sector | Weight |
| Information Technology | 31.20% |
| Financials | 16.95% |
| Industrials | 10.59% |
| Consumer Discretionary | 8.72% |
| Health Care | 8.49% |
| Communication Services | 7.69% |
| Consumer Staples | 4.65% |
| Energy | 4.01% |
| Materials | 3.80% |
| Utilities | 2.33% |
| Real Estate | 1.56% |
Data as of August 31st, 2026 | Source: MSCI.com
Sector allocation for MSCI World:
| Sector | Weight |
| Information Technology | 29.81% |
| Financials | 16.58% |
| Industrials | 11.13% |
| Health Care | 9.27% |
| Consumer Discretionary | 8.82% |
| Communication Services | 7.90% |
| Consumer Staples | 4.91% |
| Energy | 4.09% |
| Materials | 3.47% |
| Utilities | 2.39% |
| Real Estate | 1.64% |
Data as of August 31st, 2026 | Source: MSCI.com
Both indexes cover all 11 sectors, but they are increasingly tilted towards technology. Information Technology and Communication Services together make up close to 39% of ACWI and close to 38% of MSCI World. Neither index removes sector concentration risk, and investors who want less tech exposure would need to look elsewhere, for example at equal-weight or value strategies.
Number of holdings
Top 10 holdings
The top 10 holdings of the two indexes are almost the same companies, with higher weights in MSCI World because the index is smaller. The main difference is Taiwan Semiconductor (TSMC), which appears in ACWI’s top 10 but is not part of MSCI World, since Taiwan is classified as an emerging market.
Top 10 holdings: MSCI ACWI
| Company | Weight | Sector |
| NVIDIA | 4.90% | Info Tech |
| Apple | 4.47% | Info Tech |
| Microsoft | 3.44% | Info Tech |
| Amazon | 2.42% | Consumer Discretionary |
| Alphabet (Class A) | 1.90% | Communication Services |
| Taiwan Semiconductor | 1.80% | Info Tech |
| Broadcom | 1.60% | Info Tech |
| Alphabet (Class C) | 1.49% | Communication Services |
| Meta Platforms | 1.21% | Communication Services |
| Micron Technology | 1.04% | Info Tech |
| Total | 24.26% |
Data as of August 31st, 2026 | Source: MSCI.com
Top 10 holdings: MSCI World
| Company | Weight | Sector |
| NVIDIA | 5.56% | Info Tech |
| Apple | 5.07% | Info Tech |
| Microsoft | 3.90% | Info Tech |
| Amazon | 2.74% | Consumer Discretionary |
| Alphabet (Class A) | 2.15% | Communication Services |
| Broadcom | 1.82% | Info Tech |
| Alphabet (Class C) | 1.69% | Communication Services |
| Meta Platforms | 1.37% | Communication Services |
| Micron Technology | 1.18% | Info Tech |
| Tesla | 1.13% | Consumer Discretionary |
| Total | 26.61% |
Data as of August 31st, 2026 | Source: MSCI.com
All top 10 holdings of MSCI World are US companies, and so are nine of the ten in ACWI. The top 10 alone represent about a quarter of each index (24.26% in ACWI and 26.61% in MSCI World), so a handful of US tech giants drive a large part of the returns of both.
Impact of currencies
MSCI publishes both indexes in US dollars, but what really matters is the currency of the stocks inside them. Most of them are priced in dollars: the US alone is 63.59% of ACWI and 72.14% of MSCI World. If you invest in euros or pounds, your return depends both on the stocks and on how those currencies move against yours.
When the dollar weakens against your home currency, your returns shrink once converted, and when it strengthens they grow. 2025 showed how big this effect can be. MSCI World returned 21.09% in US dollars that year, while an unhedged MSCI World ETF such as the HSBC MSCI World UCITS ETF (Acc) returned about 6.9% in euros, as the dollar lost ground against the euro.
Note that buying an ETF listed in euros or pounds does not change this. The trading currency only affects how you pay for the fund. The currency exposure comes from the underlying stocks.
If you want to reduce currency risk, you can use currency-hedged share classes, such as the SPDR MSCI ACWI EUR Hdg UCITS ETF (Acc) (IE00BF1B7389, TER 0.17%) or the HSBC MSCI World UCITS ETF (Acc) EUR-Hedged (IE000QMIHY81, TER 0.16%). Hedging removes most of the currency effect, but it adds costs and also removes the gains when the dollar rises. Many long-term investors accept the currency swings and hold unhedged funds, since they tend to even out over long periods.
Availability of ETFs
As you may be aware, investing directly in an index is not possible. Instead, you can gain exposure to an index through products designed to track it, most commonly exchange-traded funds (ETFs) and index funds.
Here is a selection of UCITS ETFs replicating both indexes:
MSCI ACWI
| Name | ISIN | Ticker | TER | Replication | Income |
| SPDR MSCI ACWI UCITS ETF | IE00B44Z5B48 | SPYY | 0.12% | Physical | Accumulating |
| iShares MSCI ACWI UCITS ETF | IE00B6R52259 | SSAC | 0.20% | Physical | Accumulating |
| Amundi MSCI All Country World UCITS ETF EUR Acc | LU1829220216 | ACWI | 0.45% | Synthetic | Accumulating |
MSCI World
| Name | ISIN | Ticker | TER | Replication | Income |
| Invesco MSCI World UCITS ETF | IE00B60SX394 | MXWO | 0.05% | Synthetic | Accumulating |
| Xtrackers MSCI World UCITS ETF 1C | IE00BJ0KDQ92 | XDWD | 0.12% | Physical | Accumulating |
| HSBC MSCI World UCITS ETF USD (Acc) | IE000UQND7H4 | HMWA | 0.15% | Physical | Accumulating |
| HSBC MSCI World UCITS ETF USD | IE00B4X9L533 | HMWD | 0.15% | Physical | Distributing |
| iShares Core MSCI World UCITS ETF USD (Acc) | IE00B4L5Y983 | SWDA | 0.20% | Physical | Accumulating |
| iShares MSCI World UCITS ETF (Dist) | IE00B0M62Q58 | IWRD | 0.50% | Physical | Distributing |
TERs as of September 2026. The same ETFs can be found on other exchanges with different tickers. Synthetic ETFs do not hold the index stocks directly: they receive the index return through a swap agreement with a bank, which adds counterparty risk.
Cheapest brokers to invest in MSCI ACWI and MSCI World
Now that we’ve gone through the differences between the two indexes, the next step is choosing where to buy the ETFs. We have analysed the most important features of different ETF brokers and put together a list of four, each with its own strengths:
- eToro: best for social trading and commission-free ETF investing
- Interactive Brokers: best for the largest ETF offering
- Public.com: best for commission-free investing for US residents
- DEGIRO: best for low-cost ETF trading
Disclaimer: Investing involves risk of loss. eToro is a multi-asset investment platform. The value of your investments may go up or down. Your capital is at risk. Other fees apply. For more information, visit etoro.com/trading/fees.
| Broker | ETF fees | Minimum deposit | Number of ETFs | Regulators |
| eToro | $0 (other fees apply) | $50 (varies between countries) | 300+ | FCA, CySEC, ASIC |
| Interactive Brokers | US-listed ETFs: free on IBKR Lite (US only), otherwise up to $0.0035 per share (min: $0.35). European exchanges: 0.05% of trade value (min: €1.25) on tiered pricing | €/$/£0 | 13,000+ | FINRA, SIPC, SEC, CFTC, IIROC, FCA, CBI, AFSL, SFC, SEBI, MAS, MNB |
| Public.com | $0 commission on US-listed ETFs (other fees may apply) | $0 | 200+ | SEC and FINRA |
| DEGIRO | €/£1 on some ETFs (+ a €/£1 handling fee), plus an annual €/£2.50 connectivity fee per exchange | €/£1 | 200+ | DNB and AFM |
Conclusion
The MSCI ACWI and the MSCI World are both solid tools for broad exposure to global stock markets. ACWI includes developed and emerging markets, while MSCI World sticks to developed markets. In practice, the gap between them comes down to the roughly 12% that emerging markets represent in ACWI.
Choose MSCI ACWI if you want a single fund that covers the whole global market, including China, India, Taiwan and Korea, and slightly less dependence on the US. Choose MSCI World if you are happy with developed markets only, or if you prefer to add emerging markets separately in a weight you decide.
Over the long run MSCI World has returned a little more, although ACWI has led over the last one and three years. Both are increasingly concentrated in US technology stocks. For euro and pound investors, currency movements can matter as much as the choice of index in any given year.