Indexes such as the FTSE All-World and MSCI World track the performance of a specific group of stocks or financial assets. They essentially serve as benchmarks to gauge the market’s performance or specific sectors.
Investing in these types of indexes through ETFs and index funds that replicate the respective index’s performance is possible. Through these investment vehicles, investors achieve diversification across a broad set of companies or assets represented by the index.
In a nutshell, the difference between MSCI and FTSE is that the MSCI World index tracks the performance of companies from developed markets/countries only, while the FTSE All-World index tracks the performance of companies from developed and emerging markets.
So, FTSE might be the best fit if you want to gain exposure to emerging markets. If you prefer to gain exposure to developed markets only, MSCI could be a good fit.
In this article, we’ll dive into the differences between the FTSE All-World and MSCI World so that you can make a better-informed decision when choosing which index to invest in. We will cover performance, country exposure, sector exposure, availability of ETFs, and more.
FTSE All World vs MSCI World compared in a nutshell
Our team has compiled all the information discussed throughout the article into a table, so that it can be easier for you to observe the differences and make a decision.
| Index | FTSE All-World | MSCI World |
| Index launch | June 2000 | March 1986 |
| Markets | Developed and Emerging | Developed |
| Number of holdings | 4,264 | 1,280 |
| Top 5 Countries | US, Japan, Taiwan, UK, Canada | US, Japan, UK, Canada, France |
| Top 5 Sectors | Technology, Financials, Industrials, Consumer Discretionary and Health Care | Information Technology, Financials, Industrials, Health Care and Consumer Discretionary |
| Top 5 Constituents | Nvidia, Apple, Microsoft, Amazon.com, Alphabet Class A | Nvidia, Apple, Microsoft, Amazon.com, Alphabet Class A |
| Dividend yield | 1.57% | 1.50% |
Updated as of August 31, 2026 | Source: FTSE Russell, MSCI
Overview of the FTSE All World vs MSCI World
The FTSE All-World Index is a market-capitalization-weighted index* that represents the performance of large and mid-cap stocks from developed and emerging markets around the world. It is a subset of the FTSE Global Equity Index Series (GEIS), which covers 98% of the world’s investable market capitalisation, and it targets 90% coverage of the nine regions used to build that universe.
On the other hand, the MSCI World Index is also a market-capitalization-weighted index that tracks the performance of large and mid-cap stocks from developed markets worldwide. It covers approximately 85% of the free float-adjusted market capitalization in each of its 23 developed countries, and excludes emerging markets entirely.
*A market-capitalization-weighted index gives more importance to companies with a larger market value. This means that the performance of bigger and more successful companies will have a greater impact on the index’s value.
Performance
Which index has performed better depends entirely on the period you look at, and the answer has changed recently.
Over the last twelve months to August 2026, the FTSE All-World returned 22.8% against 20.83% for the MSCI World. Over three years the gap is narrower but still favours FTSE, at 21.0% a year against 20.62%. Stretch the window to five years and it reverses: the MSCI World returned 11.71% a year against 11.4%.
The explanation sits in the one structural difference between them. Emerging markets have had a strong run, with the MSCI Emerging Markets index up 39.66% over twelve months against 20.83% for developed markets. The FTSE All-World holds those companies and the MSCI World does not, which lifted FTSE recently. In the years when emerging markets lagged, the same structure worked against it.
| Year | FTSE All-World (%) | MSCI World (%) |
| 2025 | 23.1 | 21.60 |
| 2024 | 17.7 | 19.19 |
| 2023 | 22.6 | 24.42 |
| 2022 | -17.7 | -17.73 |
| 2021 | 18.9 | 22.35 |
| 2020 | 16.6 | 16.50 |
Calendar year returns in USD. Updated as of August 31, 2026 | Source: FTSE Russell (total return), MSCI (gross return). The two providers calculate returns on slightly different bases, so treat small differences as noise rather than signal.
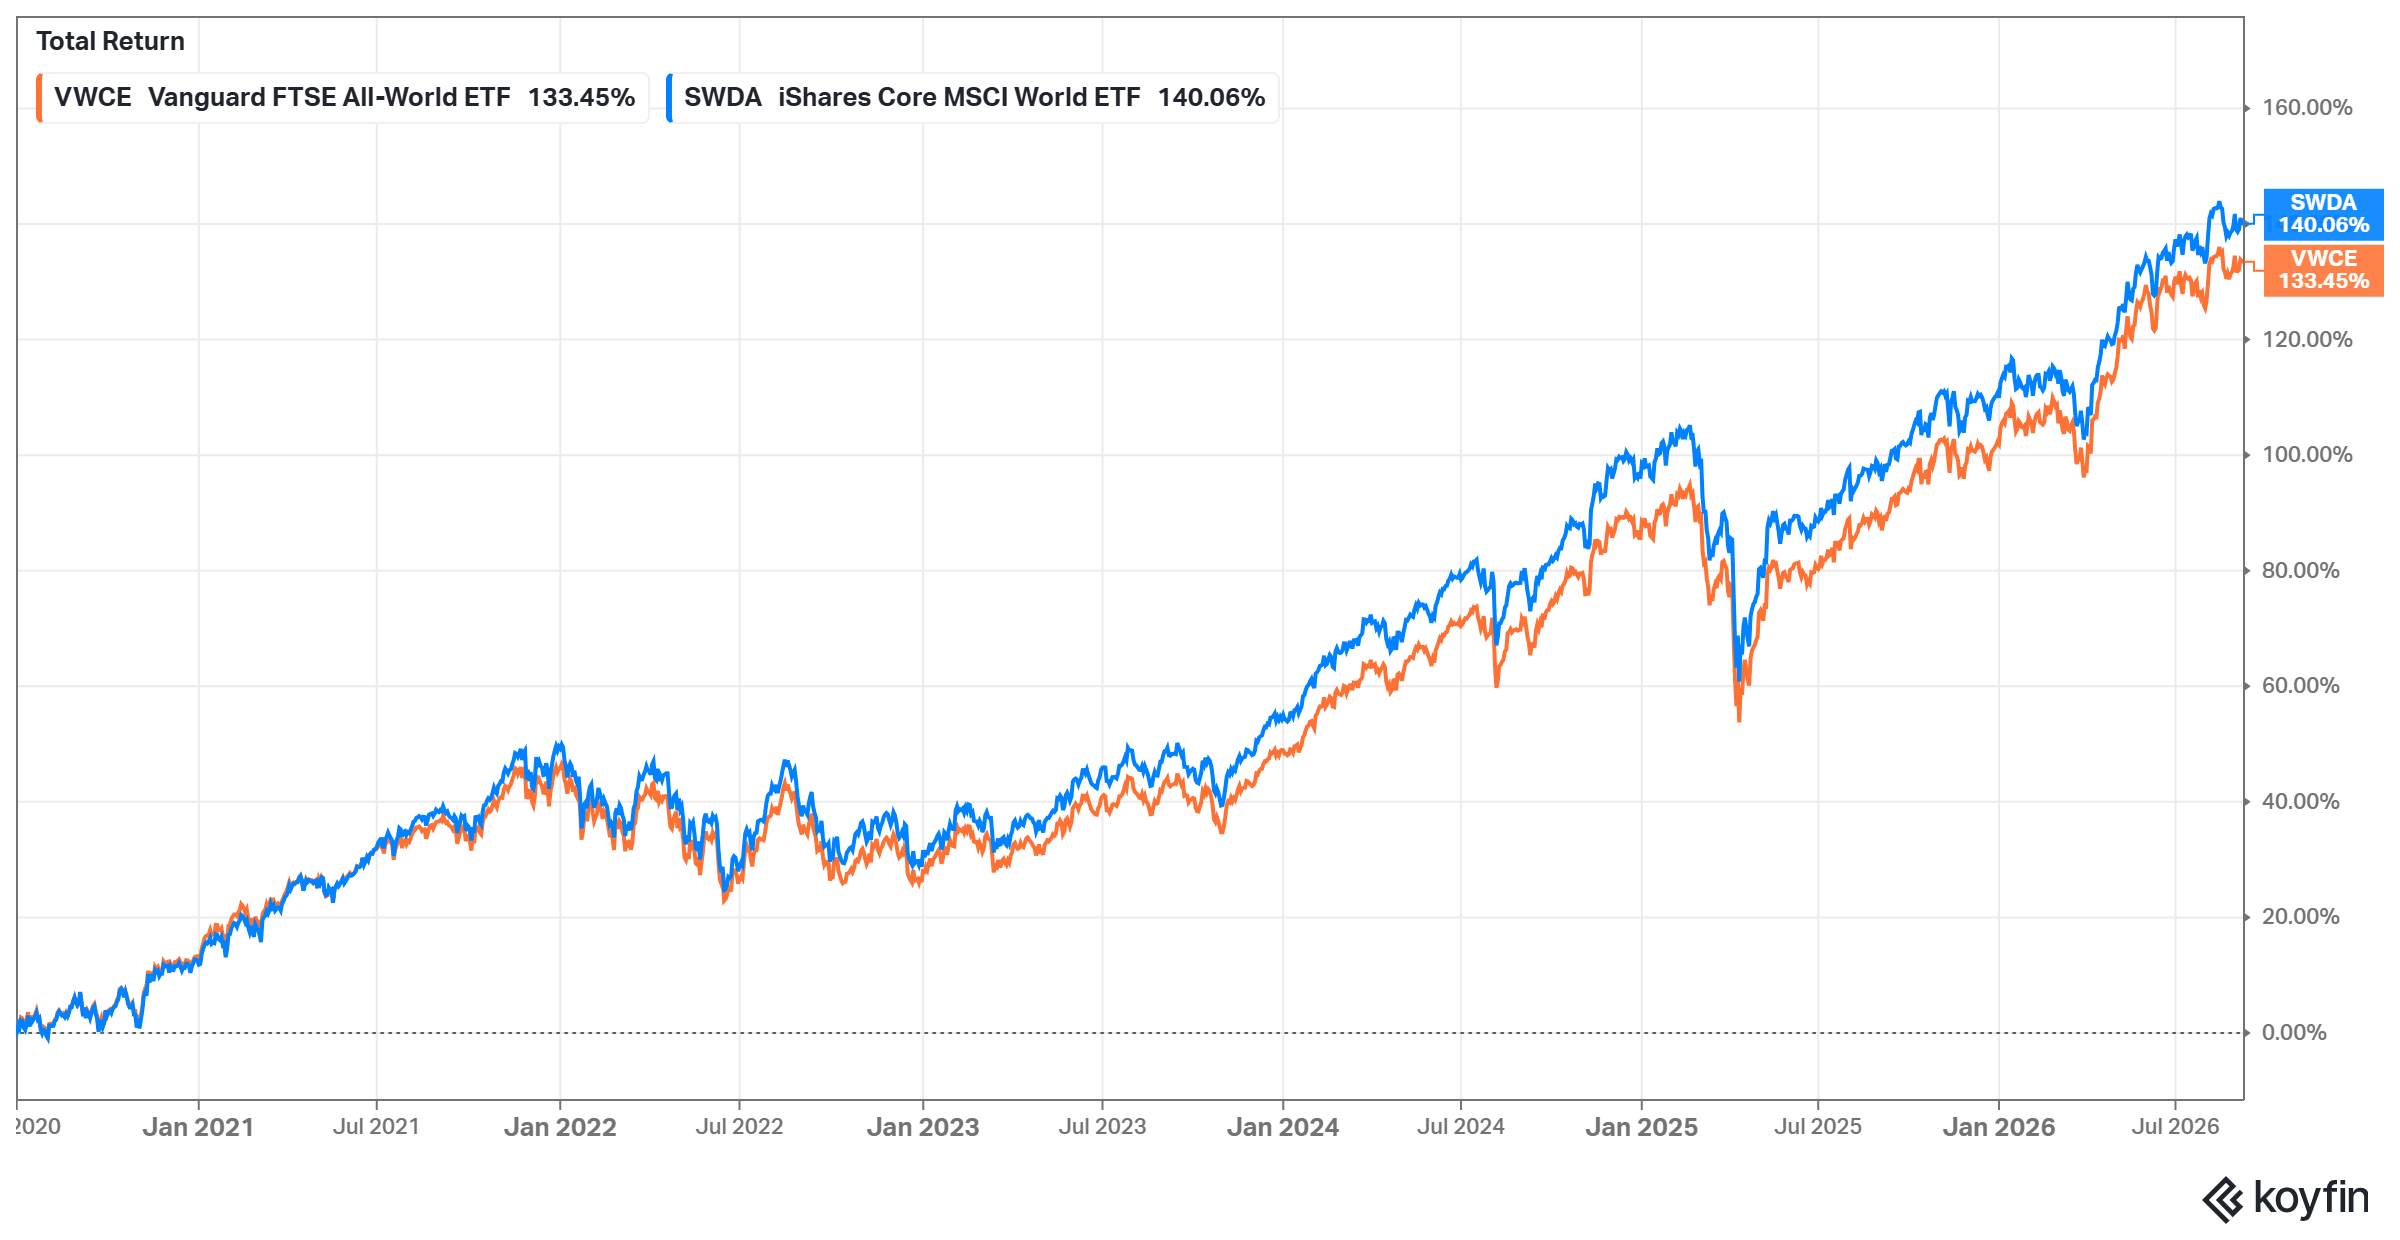
Nevertheless, it is crucial to recognise that past performance does not indicate future returns, and these results may not persist indefinitely.
Country Diversification
When it comes to country diversification, the FTSE All-World Index and the MSCI World Index have some differences.
| FTSE All-World | MSCI World | ||
| Country | Weight (%) | Country | Weight (%) |
| USA | 61.71% | USA | 72.14% |
| Japan | 5.98% | Japan | 5.78% |
| Taiwan | 3.30% | UK | 3.53% |
| UK | 3.20% | Canada | 3.46% |
| Canada | 3.00% | France | 2.36% |
| Other | 22.81% | Other | 12.74% |
Updated as of August 31, 2026 | Source: FTSE Russell, MSCI
The FTSE All-World Index aims to provide broad exposure to global equity markets by including stocks from close to 50 countries and markets, covering both developed and emerging markets. This results in a higher weighting of “other” countries, especially emerging markets. This means the index includes companies from a wide range of countries worldwide, offering investors a more comprehensive representation of global markets.
Two names in that list are worth pausing on. Taiwan is now the third-largest country weight in the FTSE All-World at 3.30%, ahead of the UK, driven largely by Taiwan Semiconductor Manufacturing. China, meanwhile, sits at 2.74% despite having 1,278 constituents in the index, far more than any other country, because most are small relative to US mega-caps.
On the other hand, the MSCI World Index focuses solely on developed markets. It includes stocks from 23 developed countries, representing a significant portion of the global market capitalisation in those markets. As a result, the MSCI World Index has narrower country diversification and a considerably heavier US weighting: 72.14% against 61.71%.
Sector Diversification
Both indices are dominated by technology, and the remaining sectors carry broadly similar weights in each.
One caveat before you compare the numbers directly: FTSE Russell classifies constituents using ICB and MSCI uses GICS. The two systems draw their boundaries in different places, which is why FTSE shows a single “Technology” bucket at 34.09% while MSCI splits its equivalent companies across “Information Technology” at 29.81% and part of “Communication Services” at 7.9%. The underlying exposure is closer than the headline percentages suggest.
| FTSE All-World (ICB) | MSCI World (GICS) | ||
| Sector | Weight (%) | Sector | Weight (%) |
| Technology | 34.09% | Information Technology | 29.81% |
| Financials | 15.49% | Financials | 16.58% |
| Industrials | 12.31% | Industrials | 11.13% |
| Consumer Discretionary | 11.04% | Health Care | 9.27% |
| Health Care | 7.98% | Consumer Discretionary | 8.82% |
| Energy | 4.15% | Communication Services | 7.90% |
| Consumer Staples | 3.89% | Consumer Staples | 4.91% |
| Basic Materials | 3.44% | Energy | 4.09% |
| Telecommunications | 3.33% | Materials | 3.47% |
| Utilities | 2.55% | Utilities | 2.39% |
| Real Estate | 1.74% | Real Estate | 1.64% |
Updated as of August 31, 2026 | Source: FTSE Russell, MSCI
Both indices spread holdings across every major sector, giving investors exposure to a wide set of industries rather than a single part of the market. That said, technology is a large single exposure in both, so neither index is as evenly spread as the number of holdings alone might suggest.
Number of Holdings
The MSCI World Index holds 1,280 constituents, covering large and mid-cap stocks from 23 Developed Markets countries. It covers around 85% of the free float-adjusted market value in each country.
In contrast, the FTSE All-World Index has a far larger number of holdings, with 4,264 constituents. This index includes large and mid-cap stocks from the FTSE Global Equity Index Series and targets 90% coverage of the regions used to construct that universe.
The gap of roughly 3,000 companies sounds dramatic, but its practical effect is smaller than it looks. Those additional holdings are mostly emerging market and smaller developed market companies, and together they account for well under a fifth of the FTSE index by weight. The top ten holdings alone make up 23.73% of the FTSE All-World and 26.61% of the MSCI World.
Top 10 Holdings
Our team has gathered the top 10 holdings of each index, and the tables confirm that they are pretty similar. The weights differ, though, and consistently in the same direction: because the MSCI World spreads the same US mega-caps across a smaller pool of companies, each one carries more weight. Nvidia is 4.79% of the FTSE All-World and 5.56% of the MSCI World.
The one genuine difference in composition is Taiwan Semiconductor Manufacturing, the sixth-largest holding in the FTSE All-World at 1.72%. It is absent from the MSCI World, because Taiwan is classified as an emerging market.
| FTSE All-World | MSCI World | ||
| Stock | Weight (%) | Stock | Weight (%) |
| Nvidia | 4.79% | Nvidia | 5.56% |
| Apple Inc | 4.26% | Apple Inc | 5.07% |
| Microsoft Corp | 3.51% | Microsoft Corp | 3.90% |
| Amazon.com | 2.35% | Amazon.com | 2.74% |
| Alphabet Class A | 1.84% | Alphabet Class A | 2.15% |
| Taiwan Semiconductor Manufacturing | 1.72% | Broadcom | 1.82% |
| Broadcom | 1.60% | Alphabet Class C | 1.69% |
| Alphabet Class C | 1.48% | Meta Platforms A | 1.37% |
| Meta Platforms Inc | 1.17% | Micron Technology | 1.18% |
| Micron Technology | 1.01% | Tesla | 1.13% |
Updated as of August 31, 2026 | Source: FTSE Russell, MSCI
Availability of ETFs
As you may already know, you cannot directly purchase an index. You need to buy a fund that tracks that index. Two funds that can track an index include exchange-traded funds (ETFs) and index funds.
Our team has compiled a selection of ETFs replicating both indices, focusing on ETFs available on European stock exchanges such as gettex, Borsa Italiana, and Xetra, among others.
FTSE All World
| Name | ISIN | Ticker* | TER | AUM | Replication method | Use of income |
| Vanguard FTSE All-World UCITS ETF Distributing | IE00B3RBWM25 | VWRL | 0.14% | EUR 9,500 M | Physical | Distributing |
| Vanguard FTSE All-World UCITS ETF (USD) Accumulating | IE00BK5BQT80 | VWCE | 0.14% | EUR 7,000 M | Physical | Accumulating |
| Invesco FTSE All-World UCITS ETF Acc | IE000716YHJ7 | FWRG | 0.15% | EUR 2,300 M | Physical | Accumulating |
*: All the tickers presented refer to the Italian stock exchange. However, the same ETFs can be found on other European exchanges with different tickers.
MSCI World
| Name | ISIN | Ticker* | TER | AUM | Replication method | Use of income |
| iShares Core MSCI World UCITS ETF USD | IE00B4L5Y983 | SWDA | 0.20% | EUR 50,000 M | Physical | Accumulating |
| HSBC MSCI World UCITS ETF USD (Acc) | IE000UQND7H4 | HMWA | 0.15% | EUR 63 M | Physical | Accumulating |
| iShares MSCI World UCITS ETF (Dist) | IE00B0M62Q58 | IWRD | 0.50% | EUR 5,400 M | Physical | Distributing |
| HSBC MSCI World UCITS ETF USD | IE00B4X9L533 | HMWD | 0.15% | EUR 5,500 M | Physical | Distributing |
| Invesco MSCI World UCITS ETF | IE00B60SX394 | SMSWLD | 0.19% | EUR 3,400 M | Synthetic | Accumulating |
*: All the tickers presented refer to the Italian stock exchange. However, the same ETFs can be found on other European exchanges with different tickers.
Cheapest brokers to invest in ETFs
Now that you’re familiar with the differences between the two indexes and have decided, it’s time to choose the best broker to move forward with your investment. That’s why we collected all this information, evaluated the most important features of different European ETF brokers, and compiled a list of the 4 ETF brokers in Europe.
Without further delay, here are four ETF brokers in Europe and why you should consider them:
- eToro: Best for social trading and commission-free ETF investing
- Interactive Brokers: Best for the largest ETF offering
- DEGIRO: Best for low-cost ETF trading
- Trading 212: Best for commission-free stock and ETF trading (Other fees may apply. See terms and conditions)
Disclaimer: Investing involves risk of loss; eToro is a multi-asset investment platform. The value of your investments may go up or down. Your capital is at risk. Other fees apply. For more information, visit etoro.com/trading/fees.
| Broker | ETF fees | Minimum Deposit | Number of ETFs | Regulators |
| eToro | $0 | $50 (varies between countries) | 300+ | FCA, CySEC, ASIC |
| Interactive Brokers | Varies by exchange with tiered Pricing: 0.05% of Trade Value (min: €1.25, max: €29.00) | €/$/£0 | 13,000+ | FINRA, SIPC, SEC, CFTC, CIRO, FCA, CBI, AFSL, SFC, SEBI, MAS, MNB |
| DEGIRO | €/£1 handling fee on the Tradegate Core Selection, around €3 on other exchanges plus a €2.50 annual connectivity fee per exchange | €/£0 | 1,000+ in the Core Selection | BaFin, AFM, DNB |
| Trading 212 | €/£0 | €/£0 | 600+ | FCA, CySEC, ASIC, BaFin |
Conclusion
To summarise, the FTSE All-World Index and the MSCI World Index offer investors broad exposure to global equity markets. The FTSE All-World Index encompasses both developed and emerging markets, while the MSCI World Index focuses solely on developed markets. This variation in country composition gives investors different exposure levels to regions and market development.
That single difference drives almost everything else. It explains why the MSCI World carries 72.14% in the US against 61.71%, why Taiwan Semiconductor Manufacturing appears in one top ten and not the other, and why the FTSE index has pulled ahead over the last year while trailing slightly over five.
Moreover, both indexes spread holdings across every major sector. Technology is the largest exposure in each, so neither is as evenly balanced as the headline number of holdings might imply.
Disclaimer: When investing, your capital is at risk and you may get back less than invested. Past performance doesn’t guarantee future results.