The VWRA is designed to track the performance of the FTSE All-World Index, which consists of large and mid-cap stocks from developed and emerging markets worldwide. In contrast, IWDA is designed to track the performance of the MSCI World Index, which consists of large and mid-cap stocks from 23 developed markets worldwide.
Both ETFs replicate the performance of their index by optimised sampling (buying a representative selection of the index constituents), and the dividends are accumulated and reinvested in the ETF.
Note: VWRA and VWCE are two tickers for the same ETF, the Vanguard FTSE All-World UCITS ETF (USD) Accumulating (ISIN IE00BK5BQT80). VWRA is the USD listing on the London Stock Exchange, while VWCE is the EUR listing on Xetra, Euronext Amsterdam and Borsa Italiana. The same happens with IWDA (ISIN IE00B4L5Y983), which also trades as EUNL and SWDA. You can find all the tickers in the “Exchanges” section.
VWRA vs IWDA compared in a nutshell
| ETF | VWRA | IWDA |
| Index tracked | FTSE All-World | MSCI World |
| Fund manager | Vanguard | BlackRock |
| Fund size | $53.4 billion | $148.9 billion |
| Exchanges | London Stock Exchange, XETRA, Euronext Amsterdam, Borsa Italiana, SIX Swiss Exchange, Bolsa Institucional de Valores | London Stock Exchange, XETRA, Euronext Amsterdam, Borsa Italiana, SIX Swiss Exchange, Bolsa Mexicana de Valores, Santiago Stock Exchange |
| Fund currency | USD | USD |
| Dividends | Accumulating | Accumulating |
| Expense ratio (TER) | 0.14% | 0.20% |
| Number of holdings | 3,782 | 1,279 |
Source: Vanguard (31 July 2026) and BlackRock (fund size 31 August 2026, holdings 7 September 2026). Fund size refers to the accumulating USD share class.
Index tracked
VWRA (Vanguard FTSE All-World UCITS ETF) and IWDA (iShares Core MSCI World UCITS ETF) are exchange-traded funds that provide exposure to global equity markets. VWRA tracks the FTSE All-World Index, which covers developed and emerging markets, while IWDA tracks the MSCI World Index, which only covers developed markets. Both ETFs offer diversified global equity exposure, but VWRA adds countries such as Taiwan, China, Korea and India.
Performance
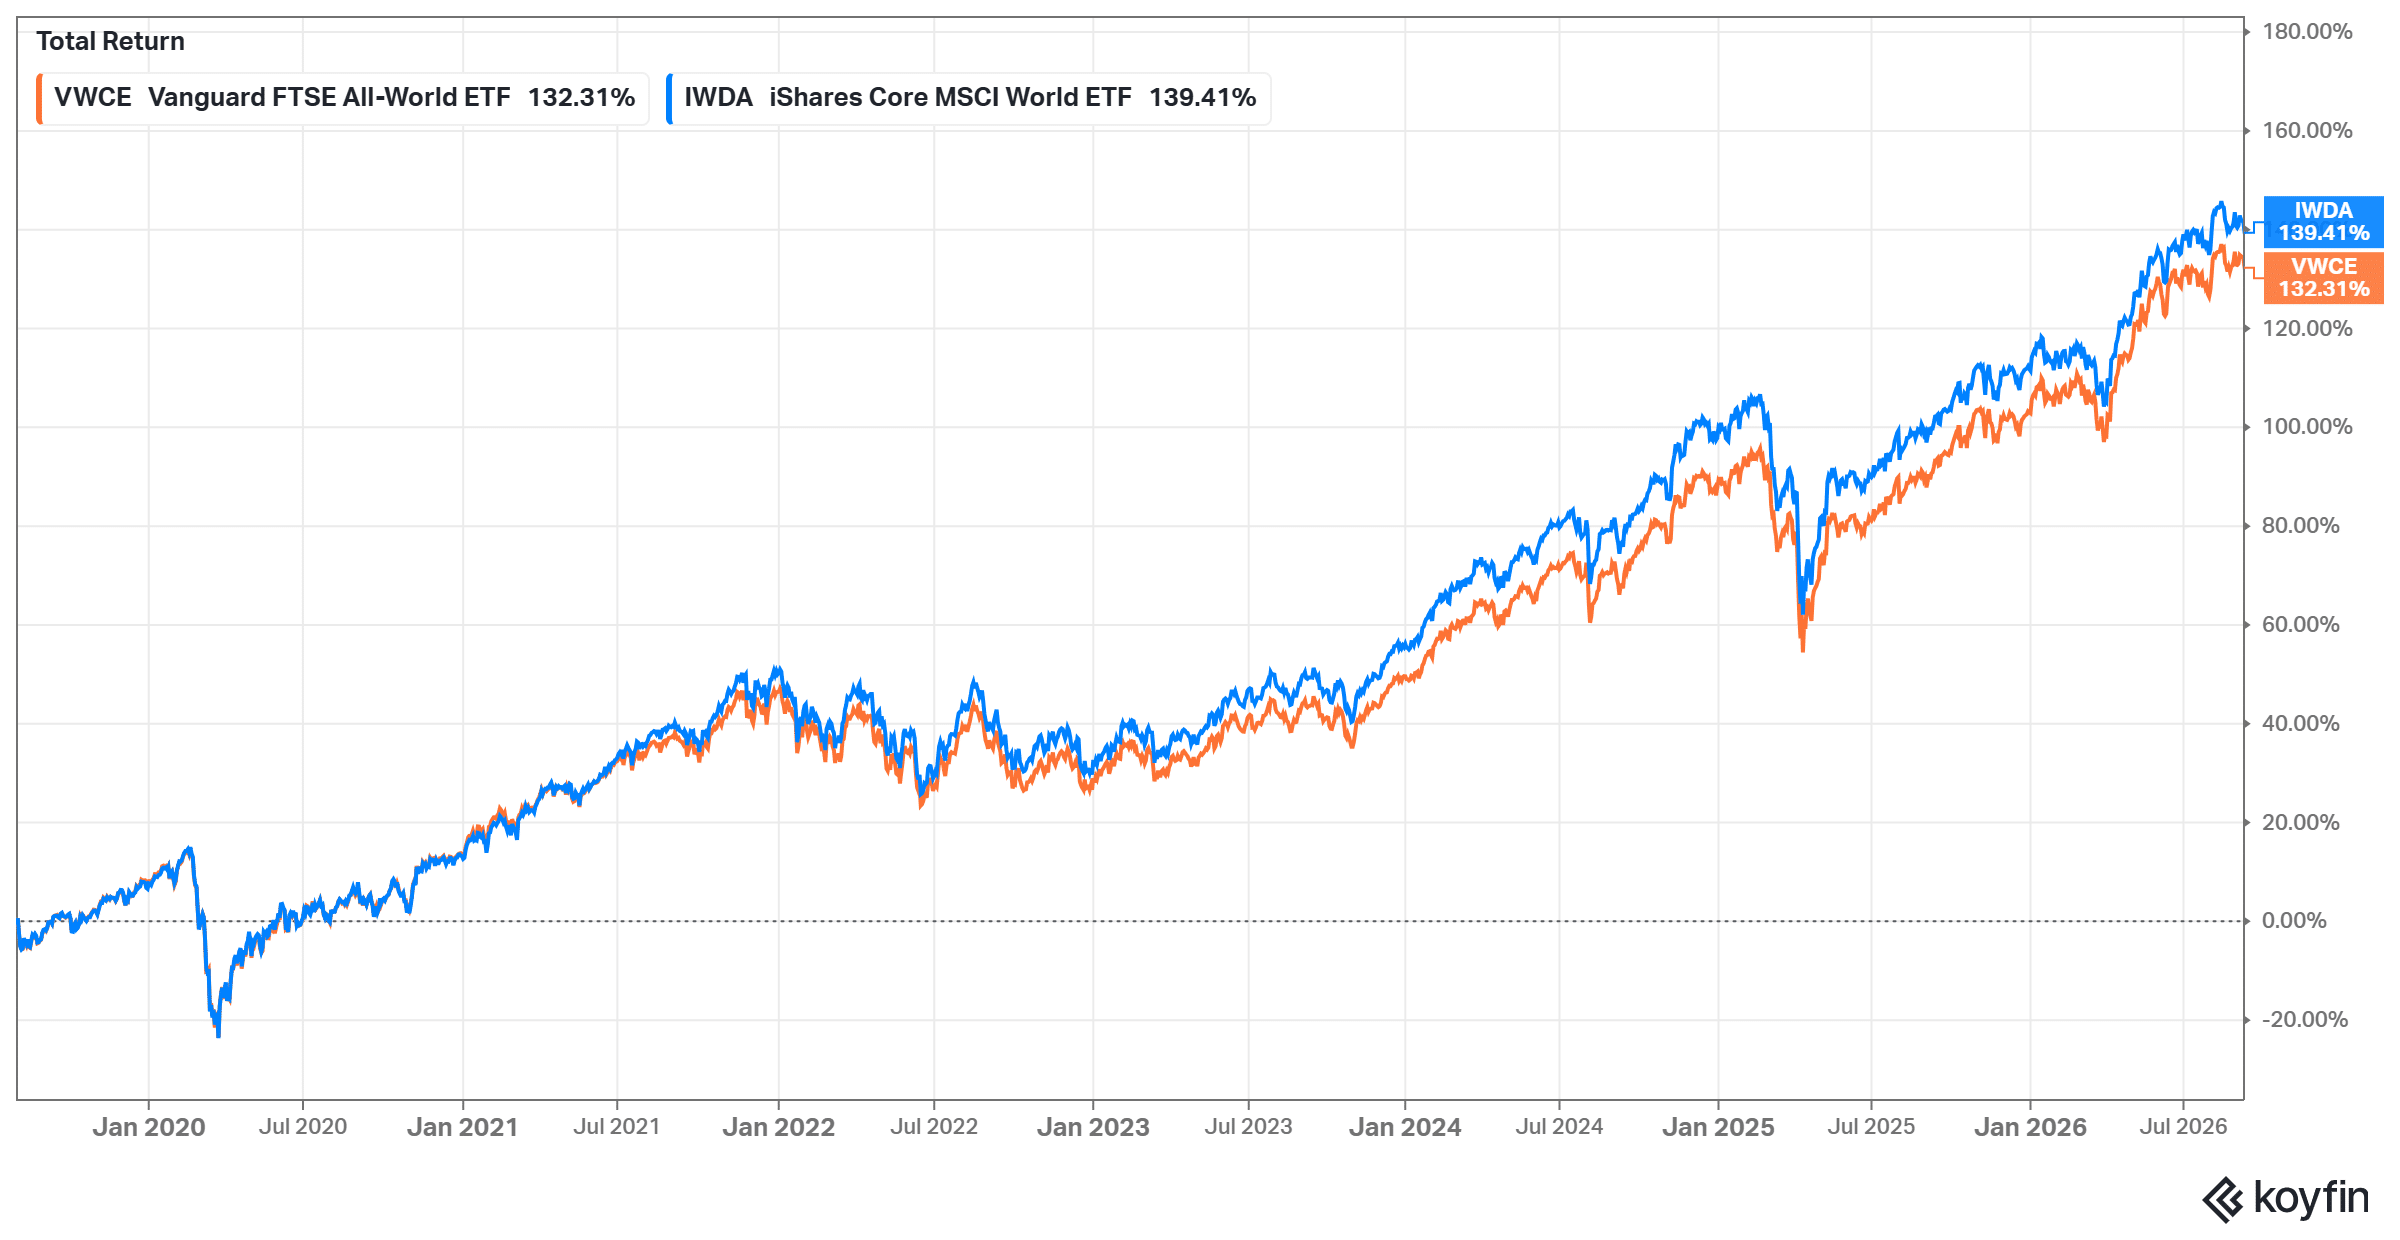
Our team has collected the historical performances of these two ETFs from August 1st, 2019 (near the inception date of the VWRA ETF) until September 10th, 2026, to showcase the performance of each one. When comparing the performance of both ETFs, it is evident that the IWDA (blue line) has outperformed VWRA (orange line).
The annual returns published by Vanguard and BlackRock confirm it: IWDA came out ahead in four of the six full calendar years since VWRA’s launch, with the biggest gap in 2021 (21.90% against 18.33%). VWRA was ahead in 2020, by only 0.04 percentage points, and in 2025, by 1.4 percentage points.
| Year | VWRA | IWDA |
| 2020 | 15.99% | 15.95% |
| 2021 | 18.33% | 21.90% |
| 2022 | -18.08% | -18.03% |
| 2023 | 22.03% | 23.86% |
| 2024 | 17.19% | 18.70% |
| 2025 | 22.56% | 21.16% |
Source: Vanguard and BlackRock factsheets | Annual NAV returns in USD, net of fees
Nevertheless, it is crucial to recognise that past performance is not indicative of future returns, and these results may not persist.
Top 10 holdings
| Stock | IWDA | Stock | VWRA |
| NVIDIA | 5.43% | NVIDIA | 4.5% |
| Apple | 5.08% | Apple | 4.3% |
| Microsoft | 3.92% | Alphabet | 3.6% |
| Amazon.com | 2.79% | Microsoft | 3.3% |
| Alphabet class A | 2.18% | Amazon.com | 2.5% |
| Broadcom | 1.79% | Taiwan Semiconductor Manufacturing | 1.7% |
| Alphabet class C | 1.71% | Broadcom | 1.7% |
| Meta Platforms | 1.37% | Meta Platforms | 1.2% |
| Micron Technology | 1.14% | Samsung Electronics | 0.9% |
| Tesla | 1.06% | JPMorgan Chase | 0.9% |
Source: Vanguard (31 July 2026) and BlackRock (31 August 2026)
Both VWRA and IWDA use physical replication. This means that the fund manager buys the stocks that make up the ETF’s benchmark index, the FTSE All-World Index and the MSCI World Index respectively. The top 10 holdings weigh 24.6% of VWRA and 26.5% of IWDA.
Fund manager
VWRA is offered by Vanguard and was launched on 23 July 2019, while IWDA is offered by BlackRock (iShares) and was launched on 25 September 2009.
Currency
Both ETFs, VWRA and IWDA, have the US dollar as their fund currency. However, each listing trades in the currency of its exchange: VWRA trades in USD on the London Stock Exchange, VWRP in GBP on the same exchange and VWCE in EUR on Xetra, Euronext Amsterdam and Borsa Italiana.
Neither ETF hedges currency risk: they are “unhedged”. The fund currency is only the accounting currency. What matters is that you are exposed to the currencies of the companies held (US dollar, Japanese yen, British pound, euro and others) against the currency you invest in.
Exchanges
As previously mentioned, these ETFs can be traded on different exchanges and currencies, resulting in different tickers. Therefore, our team has prepared a summary of how these ETFs are listed on various exchanges, along with the associated currency and ticker.
| Exchange | Trade currency | Vanguard FTSE All-World (ticker) | iShares Core MSCI World (ticker) |
| gettex | EUR | VWCE | EUNL |
| Borsa Italiana | EUR | VWCE | SWDA |
| Euronext Amsterdam | EUR | VWCE | IWDA |
| London Stock Exchange | USD | VWRA | IWDA |
| London Stock Exchange | GBP | VWRP | SWDA |
| XETRA | EUR | VWCE | EUNL |
Note: our team only selected the markets that offer both ETFs
Distribution
VWRA and IWDA are accumulating ETFs that reinvest dividends back into the fund instead of paying them out to you. This structure may interest you if you are focused on long-term capital growth and compounding. If you prefer to receive dividends, Vanguard offers a distributing version of the same fund (VWRL).
Fund domicile
Both ETFs, VWRA and IWDA, are domiciled in Ireland. Thanks to the tax treaty between Ireland and the US, Irish ETFs usually pay a 15% withholding tax on the dividends of the US companies they hold, instead of the standard 30%. ETFs domiciled in Luxembourg generally cannot benefit from the reduced rate. This tax is paid inside the fund, so a lower rate means a slightly higher net return for you.
Total expense ratio (TER)
Besides the fees you pay to your broker when trading ETF shares, there’s another cost called the total expense ratio (TER). It’s a fee charged by the fund manager to cover the expenses of running the ETF.
The TER is shown as a percentage of the fund’s assets and is deducted daily from its net asset value (NAV). For instance, if the TER is 0.50% and you have $10,000 invested in the ETF, you pay around $50 in that year (assuming the ETF’s value doesn’t change).
VWRA is cheaper than IWDA: 0.14% against 0.20% a year, or $14 against $20 a year on $10,000 invested.
| ETF | VWRA | IWDA |
| TER (%) | 0.14 | 0.20 |
Diversification
When it comes to sector distribution, both VWRA and IWDA diversify their holdings across the main sectors of the economy, such as technology, financials, healthcare, industrials and consumer goods. By diversifying across sectors, you reduce your exposure to the risks of any single sector.
Please note that Vanguard uses the ICB sector classification and BlackRock uses GICS, so the sectors don’t match exactly. For example, ICB places Alphabet and Meta in technology, while GICS classifies them as communication services, which explains most of the gap in those two rows.
| VWRA | Sector | IWDA |
| 33.4% | Technology | 29.52% |
| 15.7% | Financials | 16.51% |
| 12.6% | Industrials | 11.17% |
| 11.3% | Consumer Discretionary | 8.83% |
| 7.9% | Health Care | 9.22% |
| 4.0% | Consumer Staples | 4.89% |
| 4.1% | Energy | 4.00% |
| 3.1% | Materials | 3.45% |
| 3.3% | Communication | 7.95% |
| 2.7% | Utilities | 2.35% |
| 1.8% | Real Estate | – |
| – | Other | 2.11% |
Source: Vanguard (31 July 2026) and BlackRock (31 August 2026)
When it comes to geographic distribution, both VWRA and IWDA offer broad global diversification, with companies from North America, Europe and Asia Pacific. The main difference is the weight of the United States: 61.6% in VWRA against 71.8% in IWDA, because VWRA also holds emerging markets such as Taiwan, China and Korea.
| Country | VWRA | Country | IWDA |
| United States | 61.6% | United States | 71.78% |
| Japan | 6.0% | Japan | 5.75% |
| United Kingdom | 3.3% | United Kingdom | 3.51% |
| Taiwan | 3.2% | Canada | 3.44% |
| Canada | 3.0% | France | 2.35% |
| China | 2.8% | Switzerland | 2.24% |
| Korea | 2.4% | Germany | 2.21% |
| France | 2.1% | Australia | 1.60% |
| Switzerland | 2.0% | Netherlands | 1.41% |
| Germany | 1.9% | Spain | 0.98% |
| Others | 11.7% | Others | 4.73% |
Source: Vanguard (31 July 2026) and BlackRock (31 August 2026)
Cheapest brokers to invest in ETFs
Now that you’re familiar with the differences between the two ETFs, it’s time to choose a broker. We evaluated the most important features of different ETF brokers and compiled a list of three well-known options:
- Interactive Brokers: Best for the largest ETF offering
- Saxo: Best for advanced investors
- eToro: Best for social trading and commission-free ETF investing
Disclaimer: eToro is a multi-asset investment platform. The value of your investments may go up or down. Your capital is at risk. Other fees apply. For more information, visit etoro.com/trading/fees.
| Broker | ETF transaction fees | Min. deposit | Number of ETFs | Regulators |
| Interactive Brokers | Varies by exchange with tiered pricing: Between $0.0005 and $0.0035 per ETF share | S$0 | 13,000+ | FINRA, SIPC, SEC, CFTC, CIRO, FCA, CBI, AFSL, SFC, SEBI, MAS, MNB |
| Saxo | From 0.03% (min. $1) | S$3,000 | 6,900+ | ASIC, FSA, FCA, SFC, MAS, FINMA and DFSA |
| eToro | $0 (other fees apply) | $50 | 300+ | FCA, CySEC and ASIC |
Conclusion
In summary, both VWRA and IWDA are popular ETFs that provide exposure to global equity markets.
VWRA tracks the FTSE All-World Index, covering developed and emerging markets through around 3,800 stocks. It is also the cheaper of the two, with a TER of 0.14%.
IWDA, on the other hand, tracks the MSCI World Index, which focuses on large and mid-cap stocks from 23 developed countries. It is the larger fund and has performed slightly better since VWRA’s launch, largely thanks to its higher weight in the United States (71.8% against 61.6%).
The choice between the two depends on whether you want emerging markets in your portfolio. VWRA gives you a single ETF for the whole world, while IWDA concentrates on developed markets and can be combined with a separate emerging markets ETF if you want that exposure.