The MSCI World Index can be seen as a barometer of the global stock market, providing investors with a comprehensive snapshot of companies in developed countries’ world stock market performance.
Created by Morgan Stanley Capital International (MSCI), the index has evolved over the years, capturing crucial market trends and shifts in investor sentiment.
In this article, we hope to provide you with a deeper understanding of the index’s significance in the global financial landscape and ways to invest in it.
Quick facts about the MSCI World Index Performance:
- From December 31st, 1986, until December 31th, 2025, the index had an annualised rate of return of ~8.88% (MSCI World Total Gross Return, in USD); The net return is 6.26%, but the data is only available from December 29, 2000;
- The inflation rate for the US has been roughly 2.80% during the same period;
- The maximum drawdown was during the Great Financial Crisis of 2007-09, when its value dropped as much as 57%;
- In the last 10 years, the MSCI World Index had an annualised standard deviation of ~15%;
- Regarding geographical allocation, the index seems quite exposed to the US by presenting a weight of ~72%;
Want to know more details about the MSCI World Historical Data and Performance? Keep reading!
What is the MSCI World Index?
The MSCI World Index is a developed markets equity benchmark with exposure to 1,322 global companies within 23 developed countries, covering around 85% of each country’s listed equities (free float-adjusted market capitalization).
MSCI World Index Performance (Risk and Return)
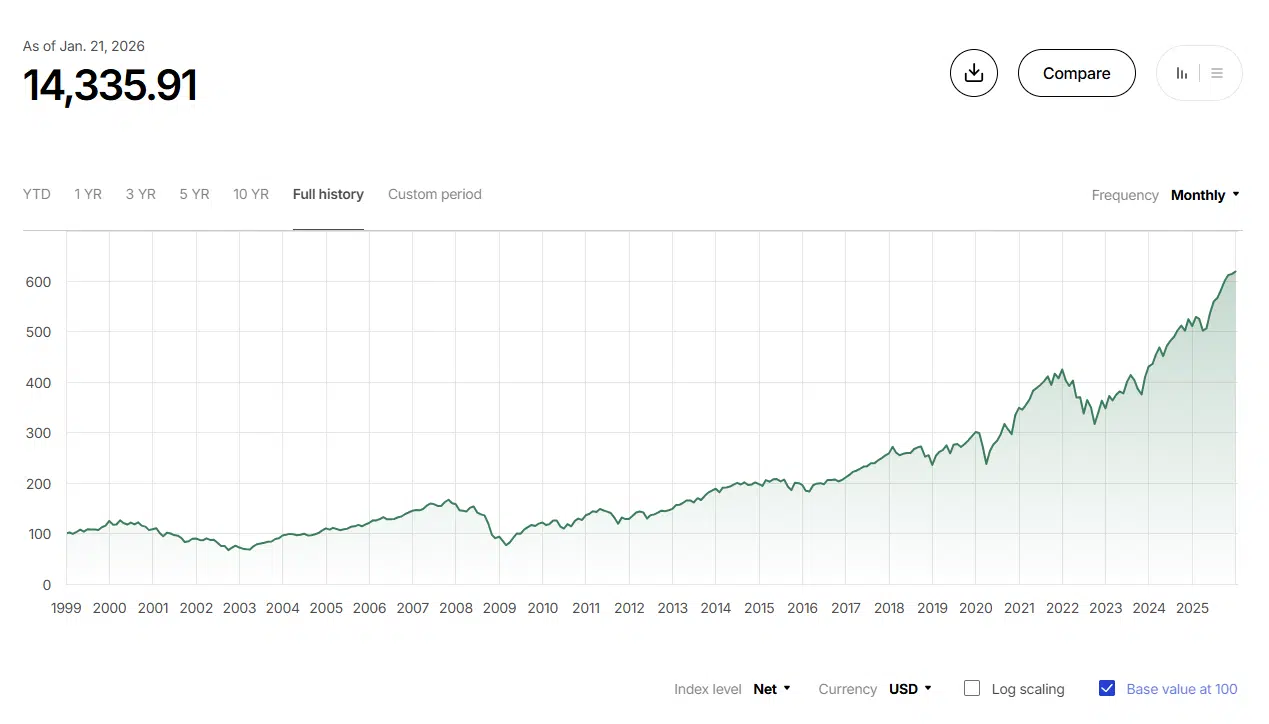
From the MSCI website, we can extract MSCI World Index data in USD from December 31st, 1969. However, the index was only launched on March 31st, 1986, meaning that data before the launch date is backtested, a set of calculations of how the index might have performed over that period if it had existed.
As such, we will be showing you the MSCI World Index performance according to the following notes:
- Only using the MSCI World historical data from its launch date since we believe it is the “true” performance (a backtest is always a backtest);
- The MSCI World performance will be presented in two currencies (both are net returns): USD (since December 31st, 2000 and EUR (since December 31st, 2000);
- We will use the Base Value of 100. This is equivalent to imagining that you invested $100 or €100 on December 31st, 2000.
MSCI World Index Net Performance (USD):
MSCI World Index – Yearly Net Returns (USD):
| Year | Net Returns (%) |
| 2025 | +21.60 |
| 2024 | +18.67 |
| 2023 | +23.79 |
| 2022 | -18.14 |
| 2021 | 21.82 |
| 2020 | 15.90 |
| 2019 | 27.67 |
| 2018 | -8.71 |
| 2017 | 22.40 |
| 2016 | 7.51 |
| 2015 | -0.87 |
| 2014 | 4.94 |
| 2013 | 26.68 |
| 2012 | 15.83 |
| 2011 | -5.54 |
| 2010 | 12.34 |
| 2009 | 30.79 |
Source: msci.com – MSCI World yearly net returns
Over the last 10 years, the MSCI World Index has yielded an annualised return of 12.17%, indicating that $100 invested on December 31st, 2015, would be worth approximately $315 as of December 31st, 2025.
If 10 years of MSCI World historical data is not a long enough period for you, we can go back to 1998 and get an annualised net rate of return of 7.21% (MSCI World Total Net Return). Thus, $100 invested on December 31st, 1998, would be worth ~$611 on JDecember 31st, 2025.
That’s a considerable increase! Especially considering that the inflation rate has been roughly 2.80% during the same period, according to WorldData.info.
MSCI World Index – Risk
Talking about returns and not about the risk (volatility) is like going to Rome and not seeing the Pope.
In the last 10 years, the MSCI World Index had an annualised standard deviation of 15.14% which, combined with the returns in the same period, gives a Sharpe ratio of 0.61 (pretty good – the higher, the better).
Finally, the maximum drawdown was during the Great Financial Crisis of 2007-09, when its value dropped as much as 57.82%.
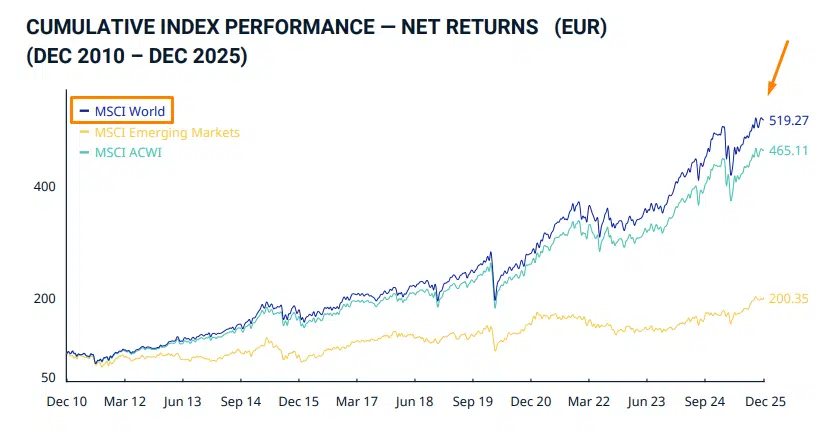
Are you a European Investor? If so, you are probably more interested in the MSCI World performance in EUR. There you go:
MSCI World Index Net Performance (EUR):
Until recently, MSCI World would only share a factsheet in USD. Now, you can also check the factsheet in EUR (net returns).
For the last 10 years, the MSCI World Index in EUR has had an annualised return of ~11.30%, meaning that €100 invested on December 31st, 2015, would be worth ~€290 on December 31st, 2025.
Again, if 10 years back is not a long enough period for you, we can go back 25 years to 2000 and get an annualised net rate of return of roughly ~6%. Hence, €100 invested on December 31st, 2000, would be worth ~€429 on December 31st, 2025.
The returns have been well above inflation during the same period (~2.20%).
Are these “real” returns for any investor?
Short answer: No. Why? Because you cannot invest directly in the MSCI World Index. Those figures would not apply to you as an investor. However, you can invest in ETFs that replicate the MSCI World Index, providing a way to invest indirectly in the index with minimal cost, resulting in a very close replication of the index.
Here is a list of the top 5 ETFs replicating the MSCI World Index that any European investor can get exposure to (ordered by Asset Under Management – AUM):
| Name | ISIN | TER (annual cost) | Replication | AUM |
| iShares Core MSCI World UCITS ETF USD (Acc) | IE00B4L5Y983 | 0.20% | Physical | +€100MM |
| Xtrackers MSCI World UCITS ETF 1C | IE00BJ0KDQ92 | 0.19% | Physical | +€16MM |
| SPDR MSCI World UCITS ETF | IE00BFY0GT14 | 0.12% | Physical | +€13MM |
| HSBC MSCI World UCITS ETF USD | IE00B4X9L533 | 0.15% | Physical | +€12MM |
| iShares MSCI World UCITS ETF (Dist) | IE00B0M62Q58 | 0.50% | Physical | +€7MM |
| Lyxor MSCI World UCITS ETF – Dist | FR0010315770 | 0.30% | Synthetic | +€7MM |
| UBS Core MSCI World UCITS ETF USD acc | IE00B0M62Q58 | 0.06% | Physical | +€6MM |
Source: justetf.com (you can find 20 ETFs in total on this source)
Using the factsheet of the first ETF in the table, iShares Core MSCI World UCITS ETF USD (Acc), you can clearly see that the ETF performance is tied to the index (the lines even get confused one over the other):
Note: Before 2013, there were some errors in the MSCI World average return calculations, which is why the graphs appeared weird during that time.
Sector allocation
The sector exposure of the MSCI World Index is quite broad. The Global Industry Classification Standard (GICS®) framework, developed both by MSCI and S&P Global, encompasses 11 sectors that are all present in the MSCI World Index:
| Sectors | Weights (%) |
| Information Technology | 27.09 |
| Financials | 17.05 |
| Industrials | 11.08 |
| Consumer Discretionary | 10.02 |
| Health Care | 9.77 |
| Communication Services | 8.78 |
| Consumer Staples | 5.26 |
| Energy | 3.34 |
| Materials | 3.23 |
| Utilities | 2.58 |
| Real Estate | 1.80 |
Source: msci.com – As of December 31st, 2025
Geographical allocation
Regarding geographical allocation, the index seems quite exposed to the US by presenting a weight of ~72%:
| Countries | Weights (%) |
| United States | 71.91 |
| Japan | 5.45 |
| United Kingdom | 3.67 |
| Canada | 3.42 |
| France | 2.64 |
| Others | 12.92 |
Source: msci.com – As of December 31st, 2025
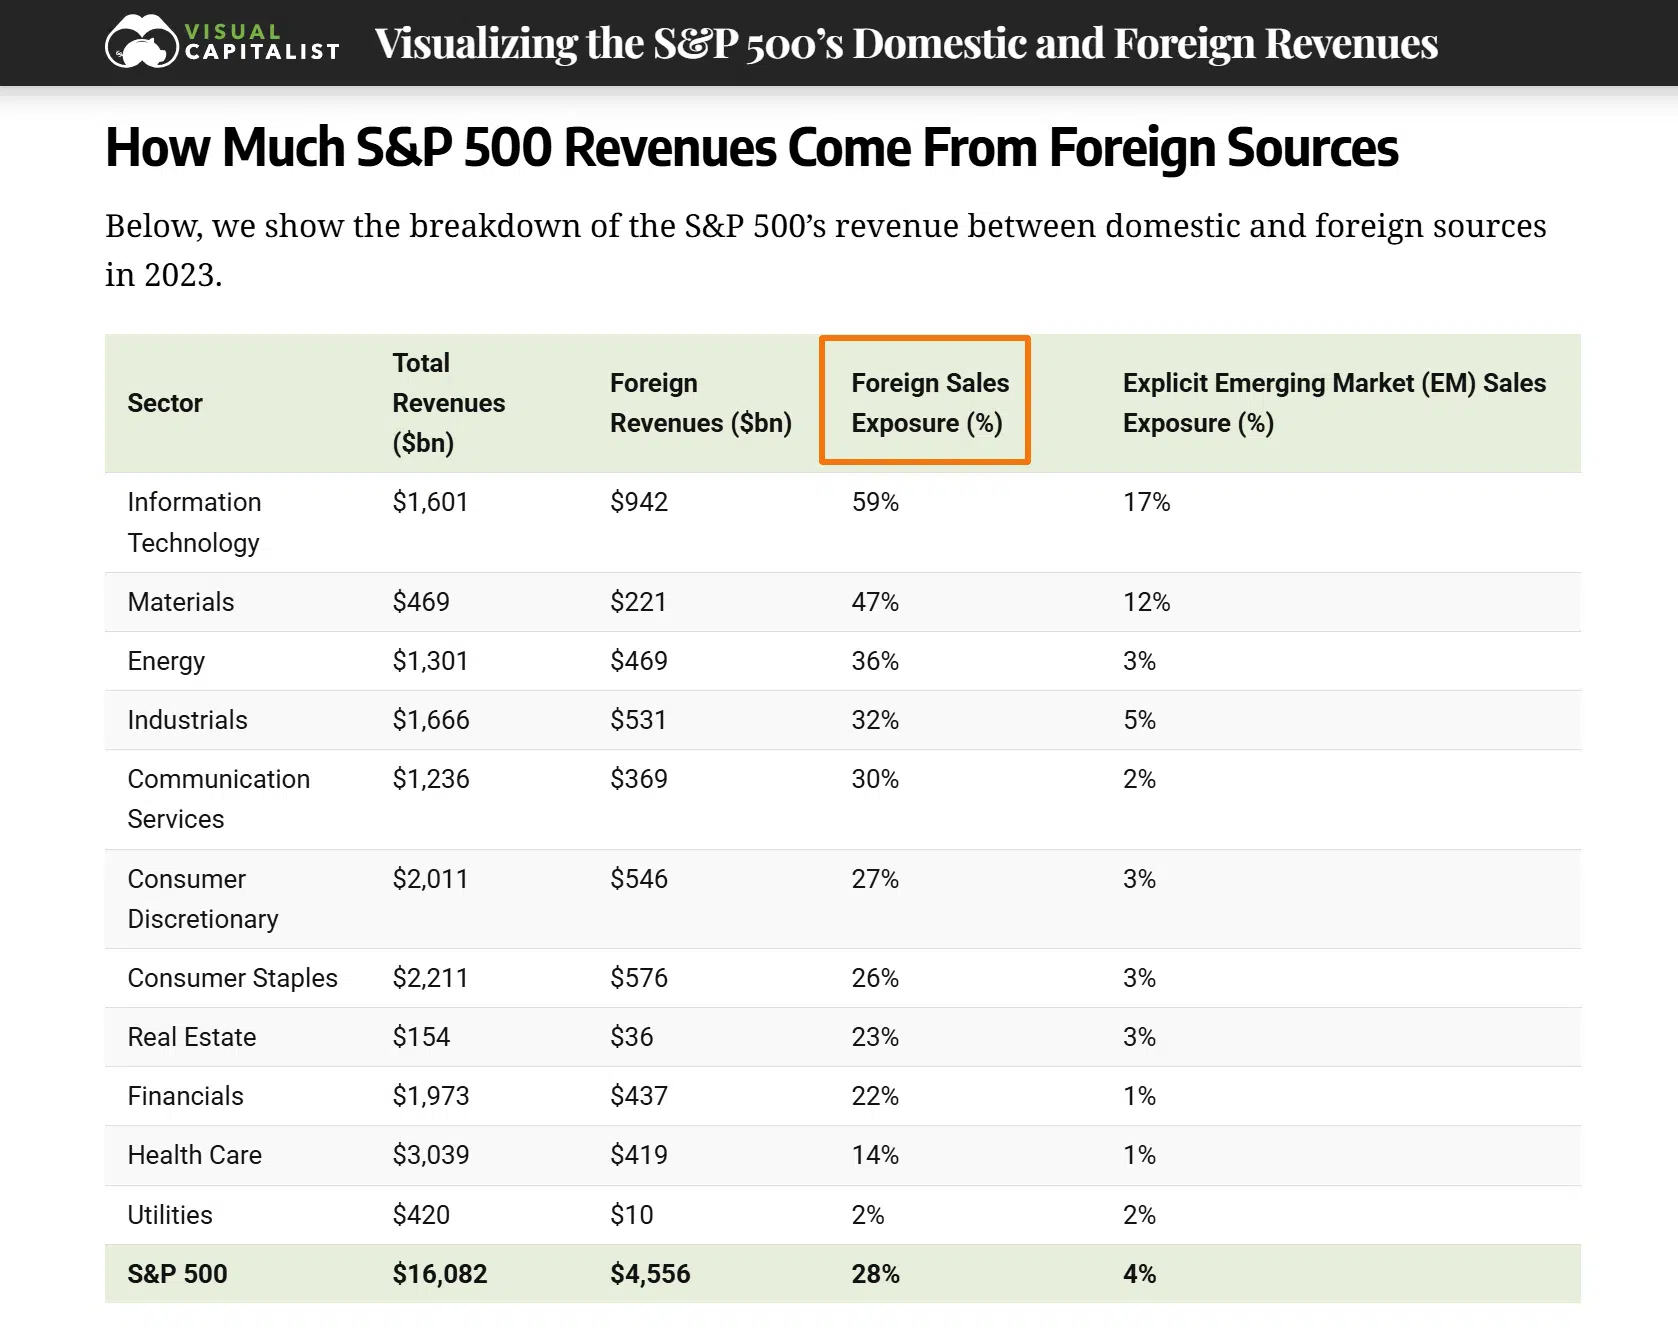
Nonetheless, remember that the country weights are only concerned with where the 1,322 companies inside the index are based (headquarters location), not where they sell their products or services. So, ~72% in the US does not equal 72% exposure to that same country.
We couldn’t find updated figures for the MSCI World Index (we only found this article from Visual Capitalist). Still, using the S&P 500 Index as a reference, which only includes US-based companies, it has “only” 70% of revenue exposure to the US (you are more diversified than you think):
Top 10 holding companies
| Companies | Weights (%) | Sectors |
| NVIDIA | 5.47 | Information Technology |
| Apple | 4.87 | Information Technology |
| Microsoft | 4.12 | Information Technology |
| Amazon | 2.67 | Consumer Discretionary |
| Alphabet A | 2.20 | Communication Services |
| Broadcom | 1.87 | Information Technology |
| Alphabet C | 1.85 | Communication Services |
| Meta Platforms | 1.73 | Communication Services |
| Tesla | 1.53 | Consumer Discretionary |
| JP Morgan Chase | 1.07 | Financials |
Source: msci.com – As of December 31st, 2025
Do you have exposure to any particular “Factor”?
In the book “Your Complete Guide To Factor-Based Investing,” the authors present several academic studies and empirical data to show that certain stocks present characteristics allowing them to earn an above-average risk-adjusted return consistently. Some of these factors are Value, Momentum, Quality, and Size. The MSCI World Index is relatively neutral on most of them:
How to Invest in the MSCI World Index?
After choosing the right ETF for you, you must select a good ETF broker to invest in it. For this example, we will use the biggest ETF replicating the MSCI World Index, the iShares Core MSCI World UCITS ETF USD (Acc).
1. Our ETF Brokers selection:
| Broker/ETF Ticker* | IWDA (EUR) | EUNL (EUR) | SWDA (EUR) |
| Interactive Brokers | ✔ | ✔ | ✔ |
| DEGIRO | ✔ | ✔ | ✔ |
| XTB** | ✘ | ✔ | ✘ |
| Lightyear | ✔ | ✘ | ✘ |
Disclaimer: Investing involves risk of loss.
*An ETF ticker is an abbreviation of one to five alphanumeric characters (letters & numbers) used to uniquely identify publicly financial assets for trading purposes. So, all tickers represent the same ETF but in different trading venues;
**XTB only offers ETFs in the Czech Republic, Dubai, France, Germany, Italy, Poland, Portugal, Romania, Slovakia, Spain, South America, and the UK.
And obviously, not less important are the fees, the minimum deposit, the overall number of ETFs provided, and the regulators. Our summary:
| Broker | ETF Fees | Min. deposit | Number of ETFs | Regulators |
| Interactive Brokers | Varies by exchange with tiered Pricing: 0.05% of Trade Value (min: €1.25, max: €29.00) | €/$/£0 | 13,000+ | FINRA, SIPC, SEC, CFTC, IIROC, FCA, CBI, AFSL, SFC, SEBI, MAS, MNB |
| DEGIRO | £/€0 (in some ETFs + €/£1 handling fee), plus an annual £/€2.50 connectivity fee | €/£1 | 200+ | DNB and AFM |
| XTB* | $/€/£0 | €/$/£1 | 100+ | FCA, KNF, CySEC, DFSA and FSC |
| Lightyear | No execution fees | €/$/£1 | 500+ | FCA, EFSA |
*XTB only offers ETFs in the Czech Republic, Dubai, France, Germany, Italy, Poland, Portugal, Romania, Slovakia, Spain, South America, and the UK.
2. Place a “Buy Order”
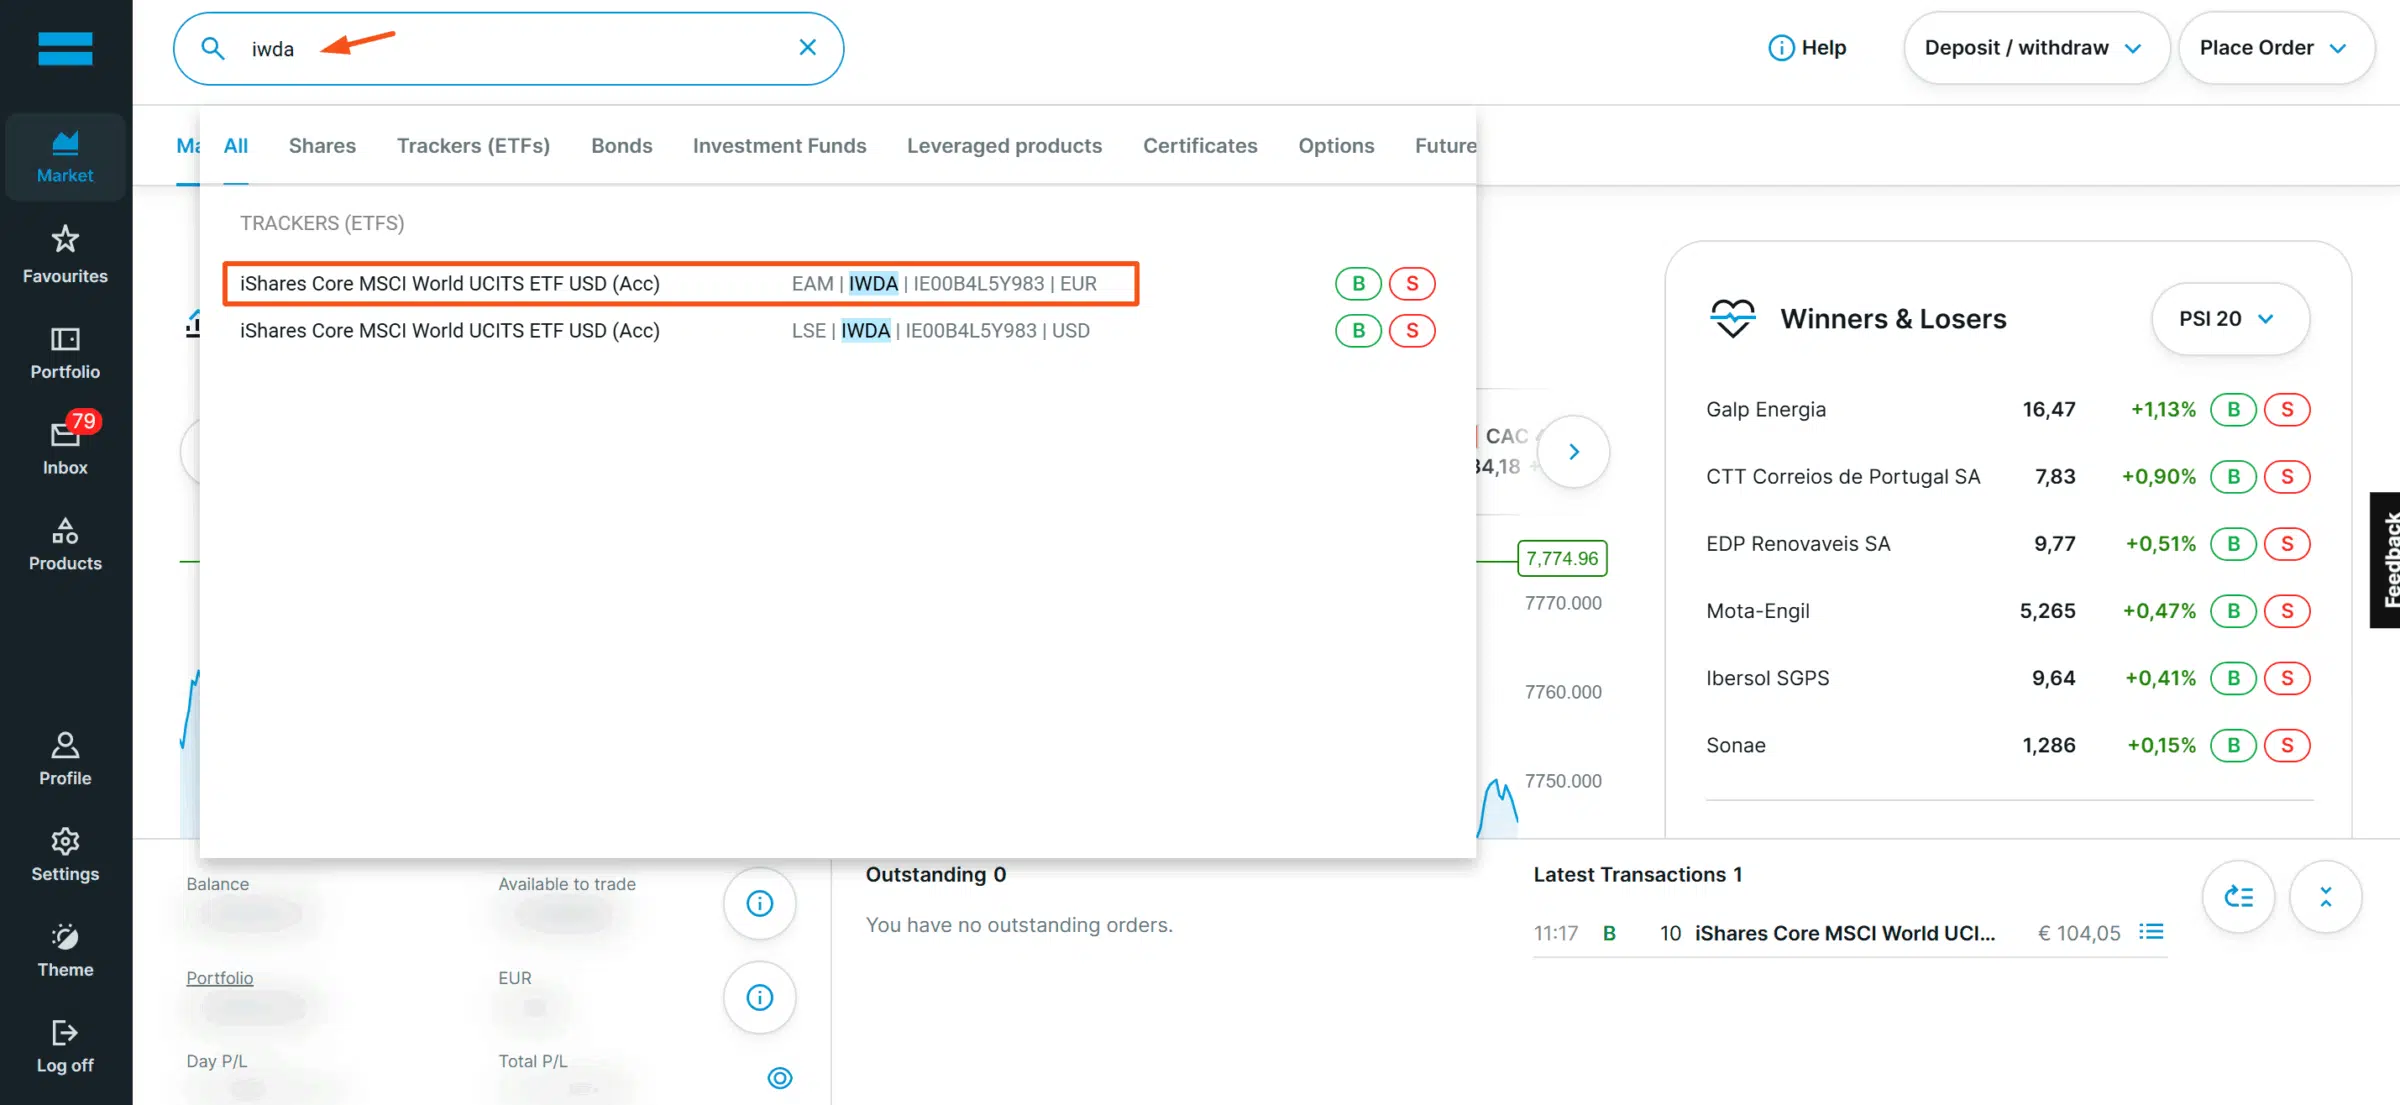
If you have found an online broker that suits your needs, managed to open an investment account, and made the initial deposit, you are all set to buy one or more units of the iShares Core MSCI World UCITS ETF USD (Acc)! All you have to do is find the ETF within your chosen broker and place a buy order. For this example, we will use DEGIRO:
a) Search for the chosen ETF (we will use “IWDA” ):
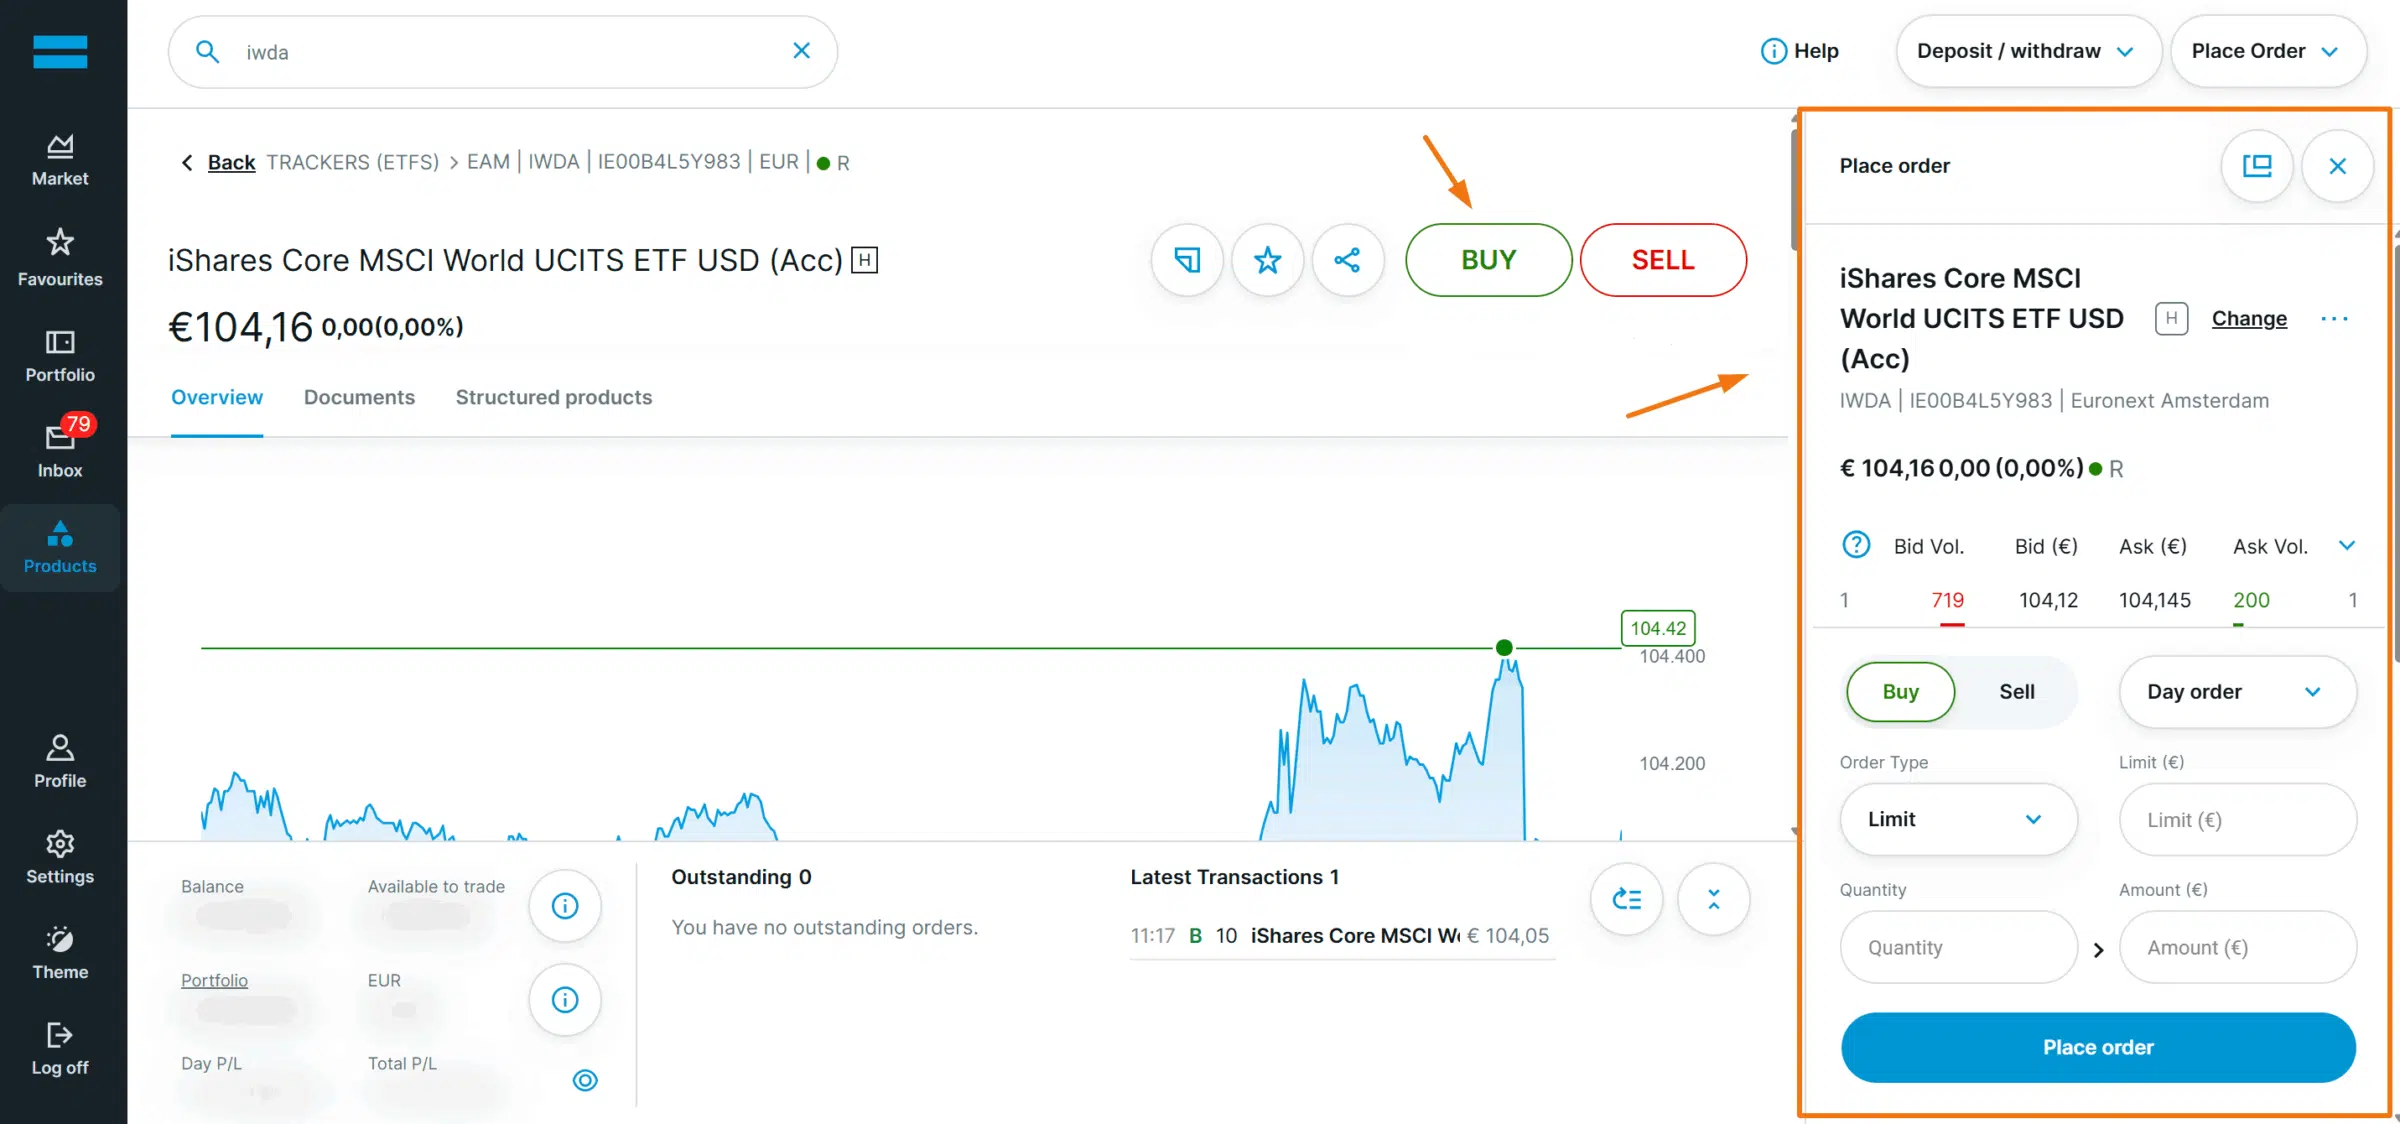
b) Click “Buy”: As you noticed, two ETFs appear, one in EUR and another in USD. Since you are a European investor, you should go for the EUR version since it saves you money from currency exchange fees. After selecting it and clicking “BUY”, you will be presented with the table shown on the right side:
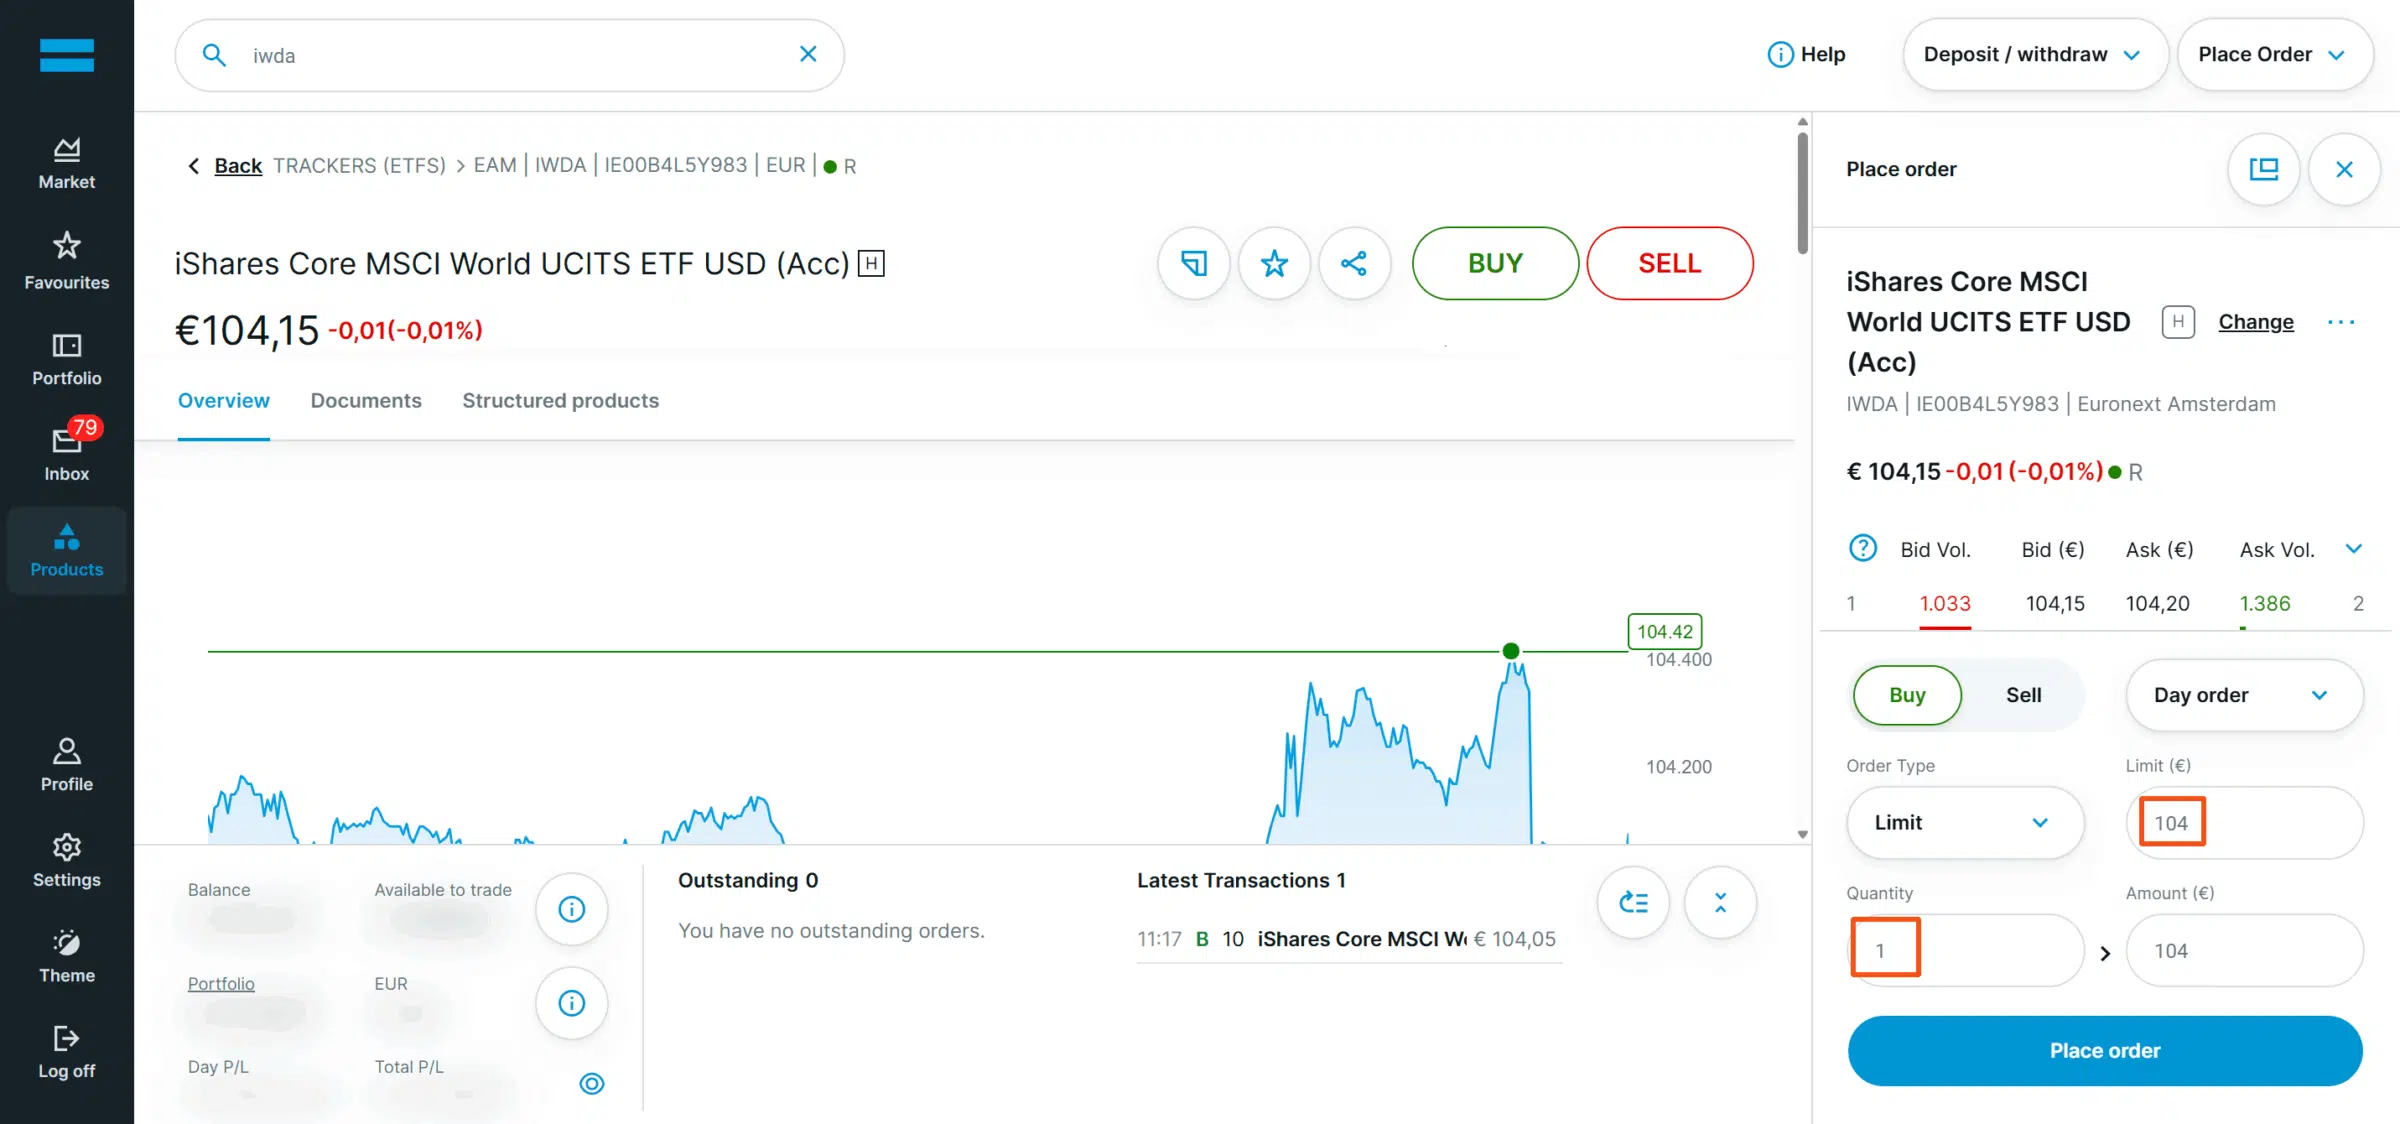
c) Choose the order details. Now, it’s time to fill all boxes presented below (“BUY” and “Day order” appear by default):
- Type of order: “Limit” appears by default because it supposes you want to buy at a maximum price, but you can change to “Market order,” for example, where you will buy at the prevailing market price;
- Limit Amount: Assuming you kept the “Limit” as the type of order, you need to insert that maximum amount in the box right after “Limit (€)”;
- Quantity: In “Quantity,” define the number of units you want to purchase;
- Amount: The “Amount (€)” should be automatically filled as soon as “Limit (€)” and “Quantity” are defined.
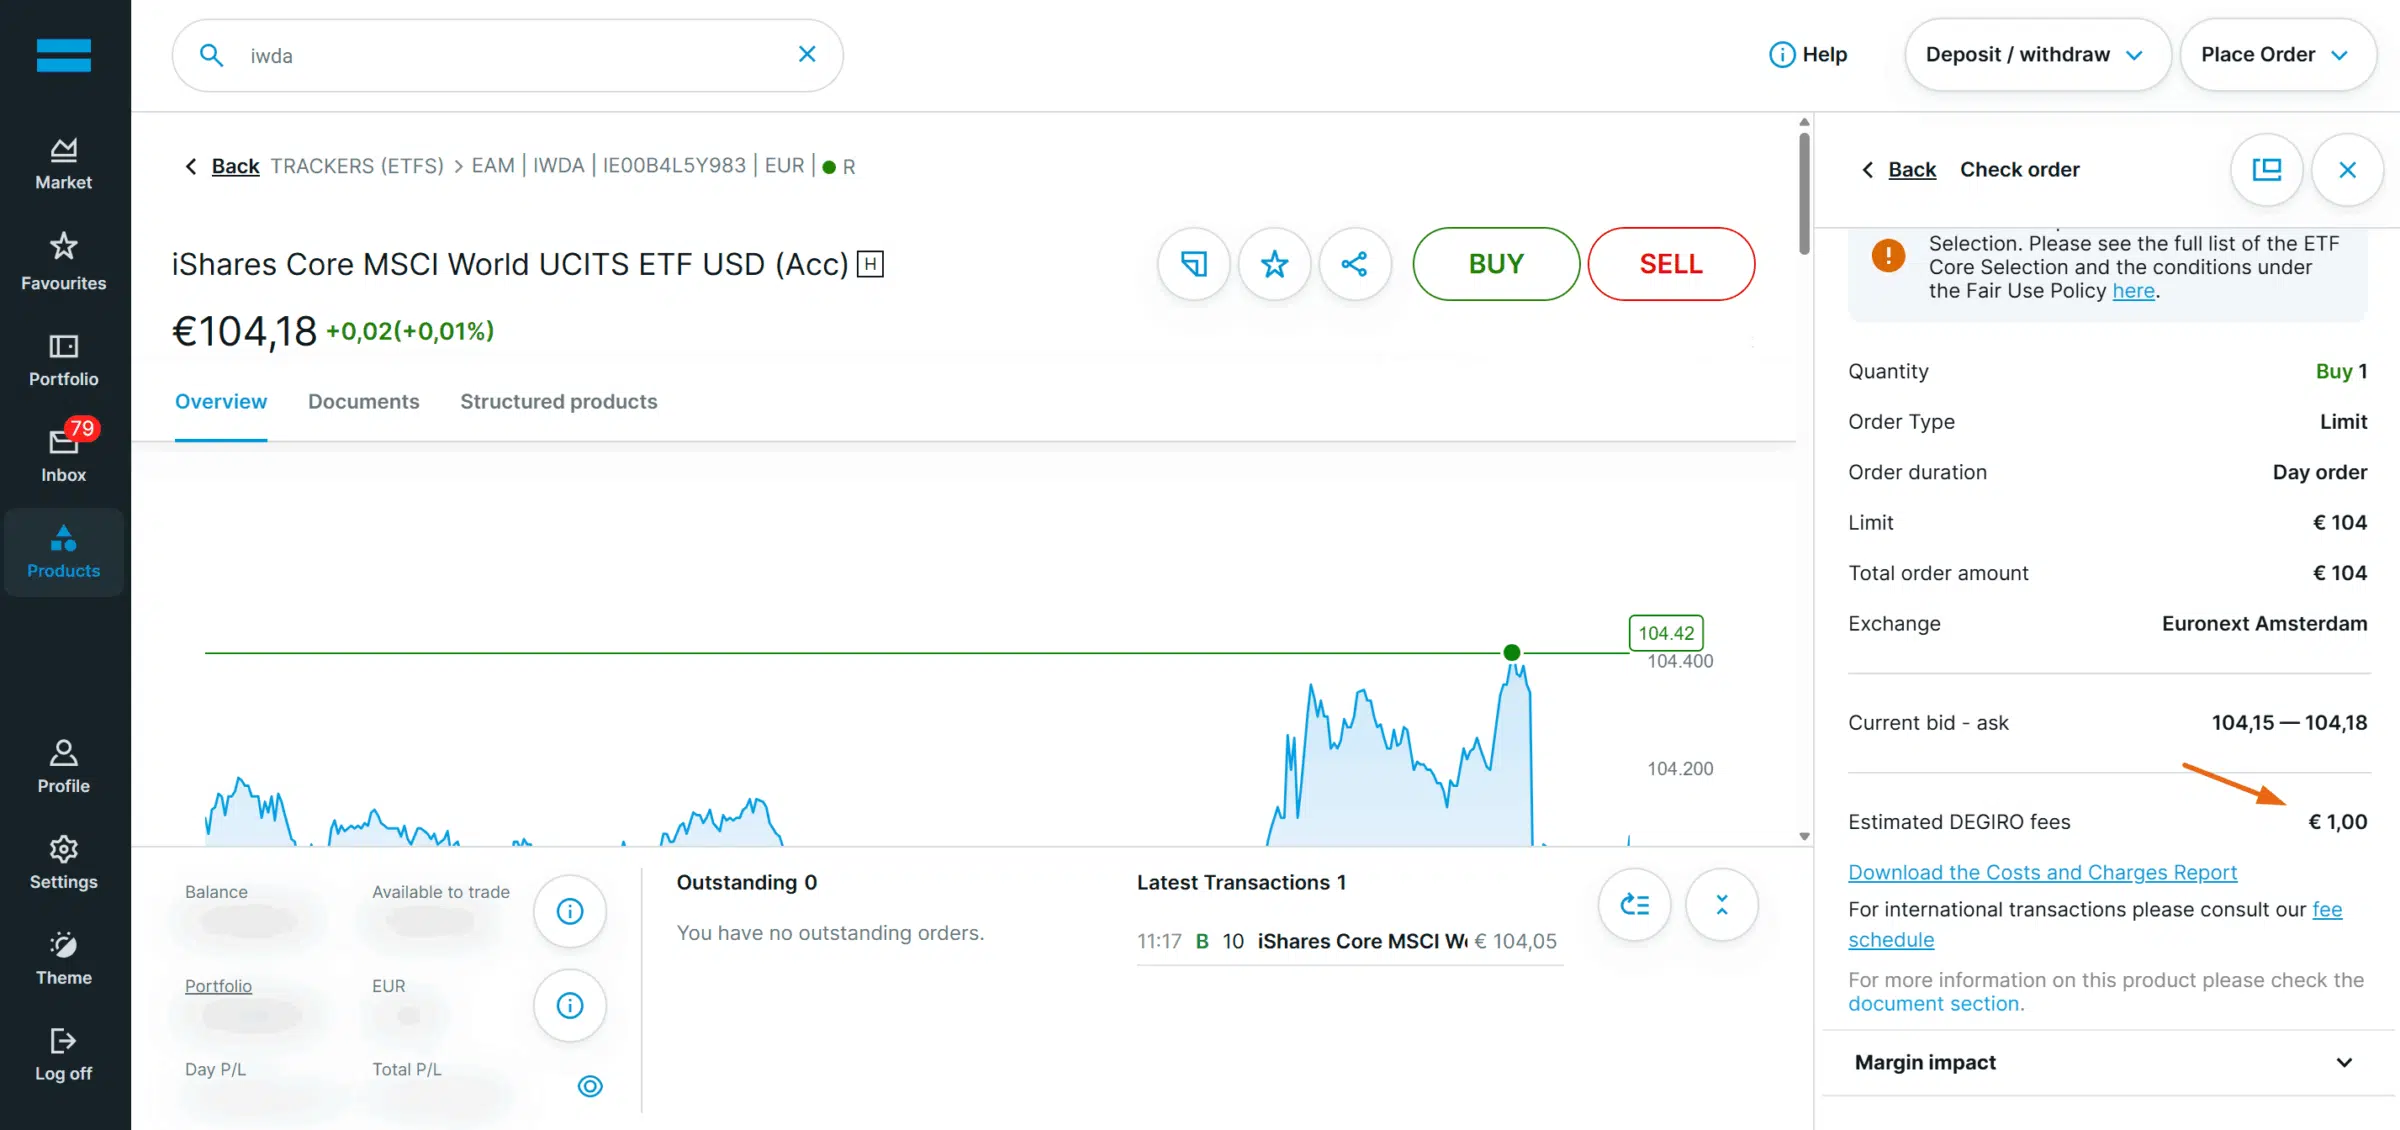
d) Place the order: Finally, click “Place Order,” and a new window appears. Here, you can take a final look at all the details before clicking “confirm”:
Tools to further analyse the performance of the MSCI World Index
In case you want to explore the MSCI World Index at a deeper level or just get another insight from other sources, we encourage to visit the following pages:
MSCI
Obviously the first one should the creator of the Index. Within the MSCI World Index section, you will find several resources that we used to write this article, such as a Brochure, Market Allocation, how the index was developed, a comparison to other indices, and a graph with the daily performance. From there, you can also get the factsheet and a detailed analysis of its historical performance.
Portfolio Analyser
Portfolio Analyser is our in-house tool to compare different ETFs. Using the iShares Core MSCI World UCITS ETF USD (Acc), we can know how an investment in this ETF would have performed over time. Plus, you get additional information, like the annual returns and drawdowns.
Bottom Line
Over the past five decades, the MSCI World Index has witnessed a variety of economic cycles, market crashes, and recovery periods. These fluctuations have provided valuable insights for investors, economists, and policymakers in understanding the interconnectedness of global markets and the impact of geopolitical events on financial performance.
The MSCI World Index gives valuable exposure to the worldwide markets, reducing the tendency to suffer from home bias.
The lack of direct exposure to emerging markets equity exposure may impact the future performance of the index. Still, it already gives you indirect exposure to those markets (from revenue sources), so you are not missing any growth potential from those geographical areas.
Are you planning to get some exposure to the MSCI World Index? If so, you can explore the best trading platforms in Europe for that or even go through our BrokerMatch tool.
