In the world of ETFs, simplicity is often key. Whether you’re a seasoned investor or just starting out, choosing the right fund can make all the difference.
Two of the most popular options on European brokerage shelves are VWCE and IWDA, both offering broad market exposure but with one critical difference: emerging markets coverage. Which one fits your strategy?
This article breaks down their key differences, performance data, and the practical trade-offs that should inform your choice.
Overview
| ETFs | VWCE | IWDA |
| Asset manager | Vanguard | BlackRock (iShares) |
| Replicated index | FTSE All-World Index | MSCI World Index |
| Market coverage | Developed and emerging markets (3,784 stocks) | 23 developed markets (1,279 stocks) |
| ISIN | IE00BK5BQT80 | IE00B4L5Y983 |
| AUM (share class) | $58.0 billion | $148.9 billion |
| Inception date | 23 July 2019 | 25 September 2009 |
| Fund currency | USD | USD |
| Domicile | Ireland | Ireland |
| Replication | Physical | Physical |
| Main EUR listings | VWCE (Xetra, Euronext Amsterdam, Borsa Italiana) | IWDA (Euronext Amsterdam), EUNL (Xetra) |
| Distribution | Accumulating | Accumulating |
| TER | 0.14% p.a. | 0.20% p.a. |
What are the VWCE and the IWDA?
VWCE
The VWCE ETF, whose full name is “Vanguard FTSE All-World UCITS ETF USD Accumulation,” is a Vanguard fund replicating the FTSE All-World index. This fund was launched in July 2019.
This ETF uses physical replication with sampling: it holds a representative sample of the index rather than every stock. At the end of August 2026, the VWCE portfolio held 3,784 stocks out of the 4,263 in the index.
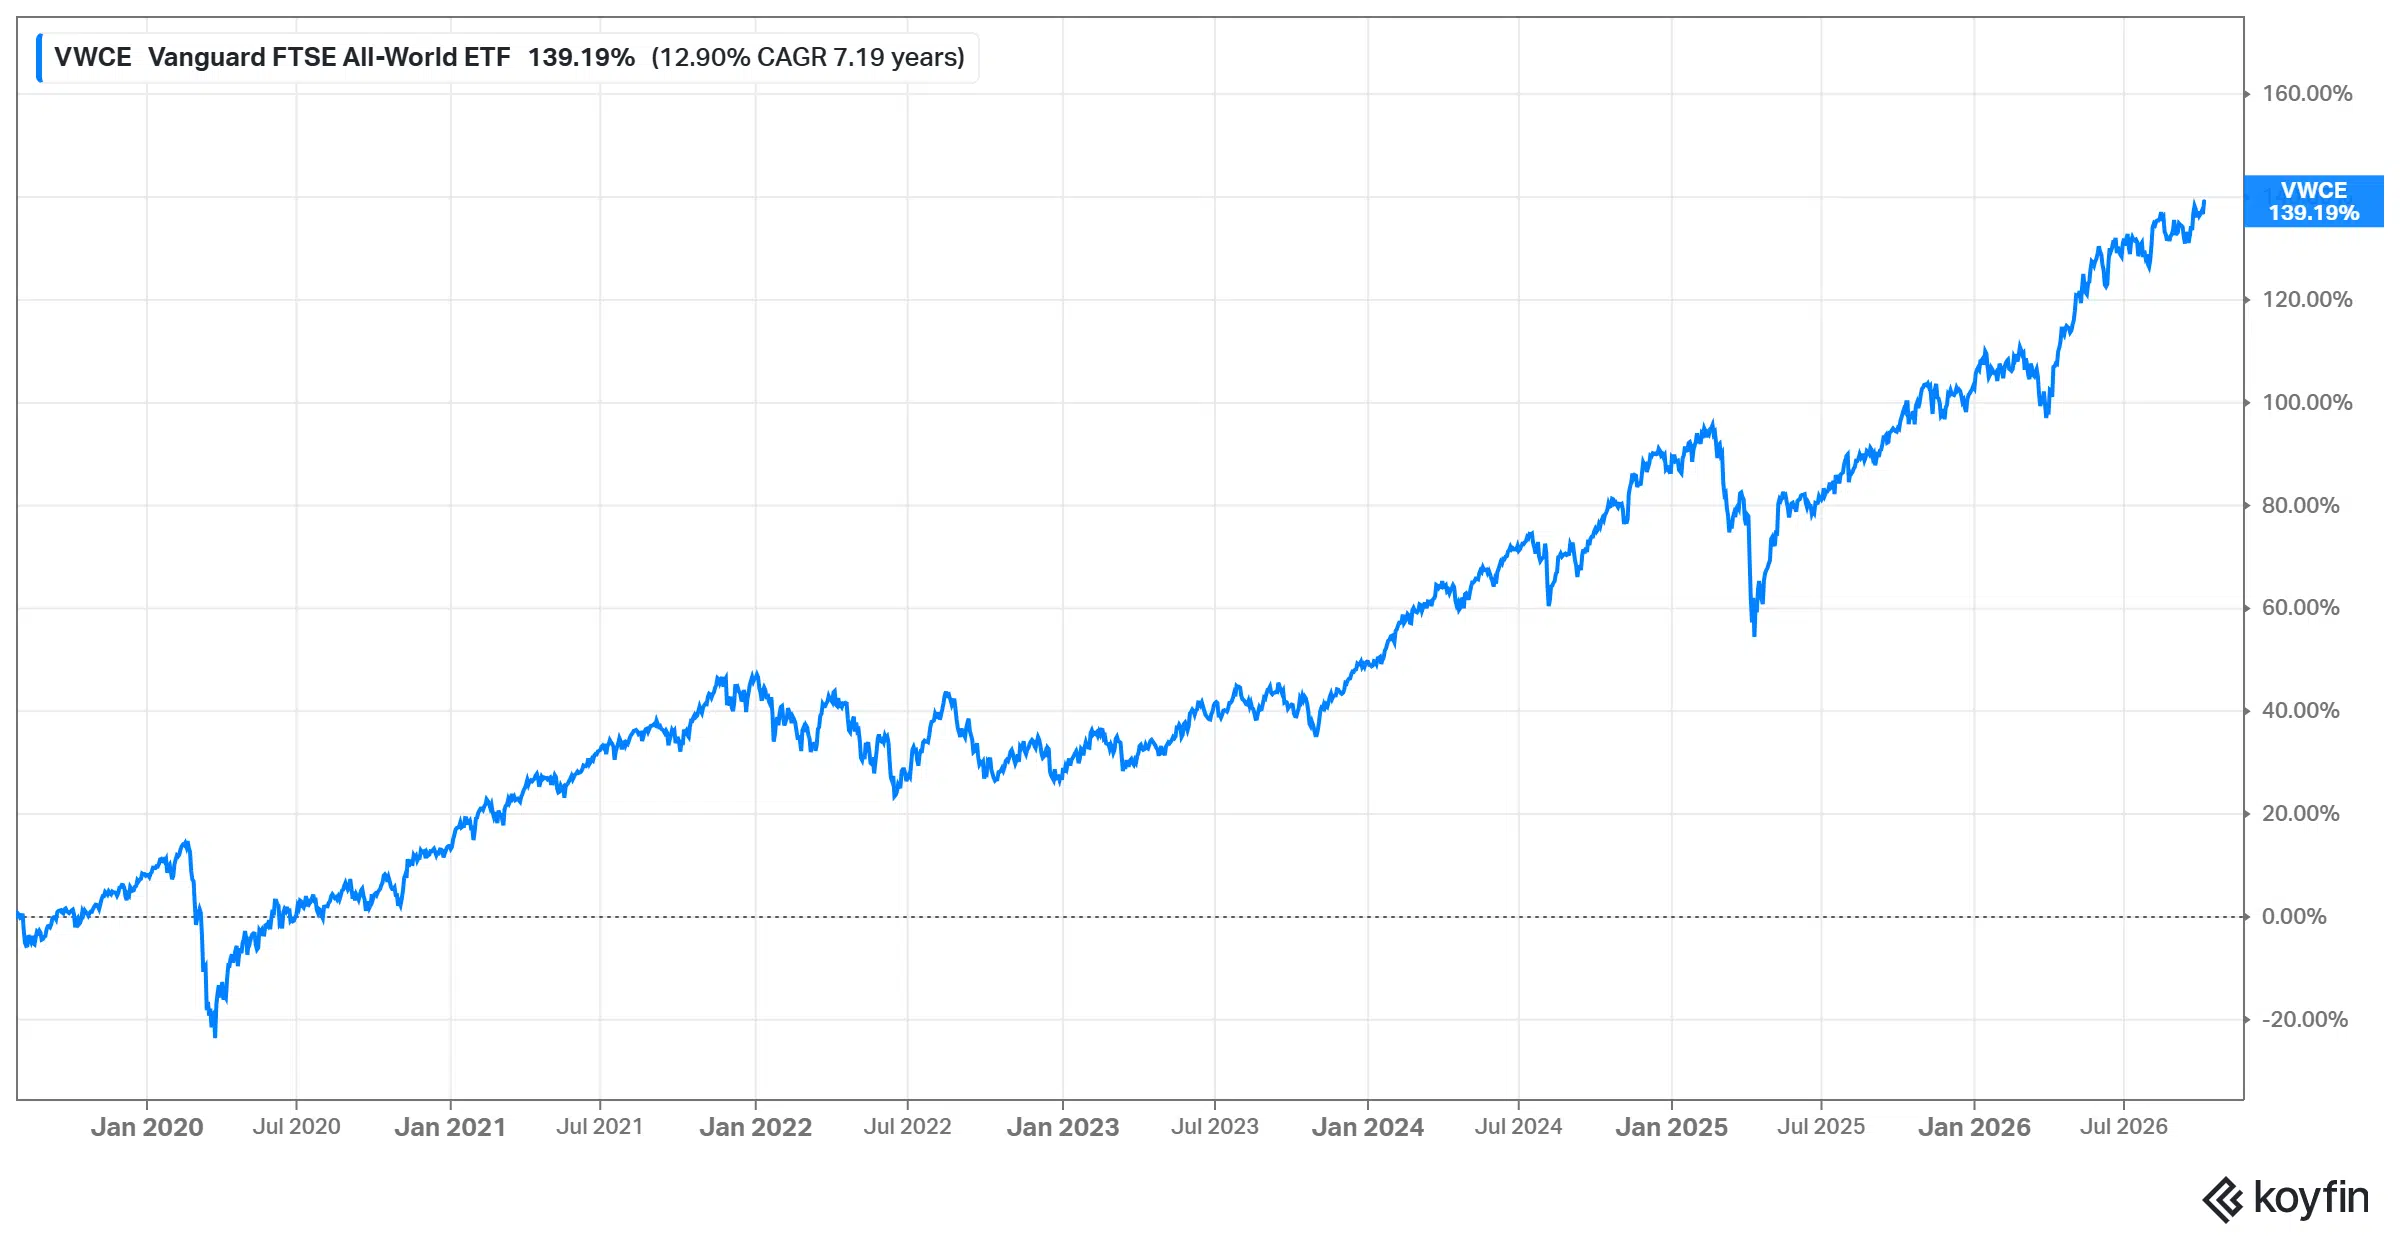
From its launch to early October 2026, its cumulative return in euros was +139.19%, or 12.9% a year:
IWDA
The IWDA ETF, whose full name is “iShares Core MSCI World UCITS ETF USD (Acc),” is a BlackRock fund whose benchmark is the well-known MSCI World Index. This fund, launched in September 2009, is one of the largest ETFs in Europe, with about $149 billion in its main share class.
IWDA’s replication is physical and optimised, holding actual securities that closely match the benchmark’s portfolio.
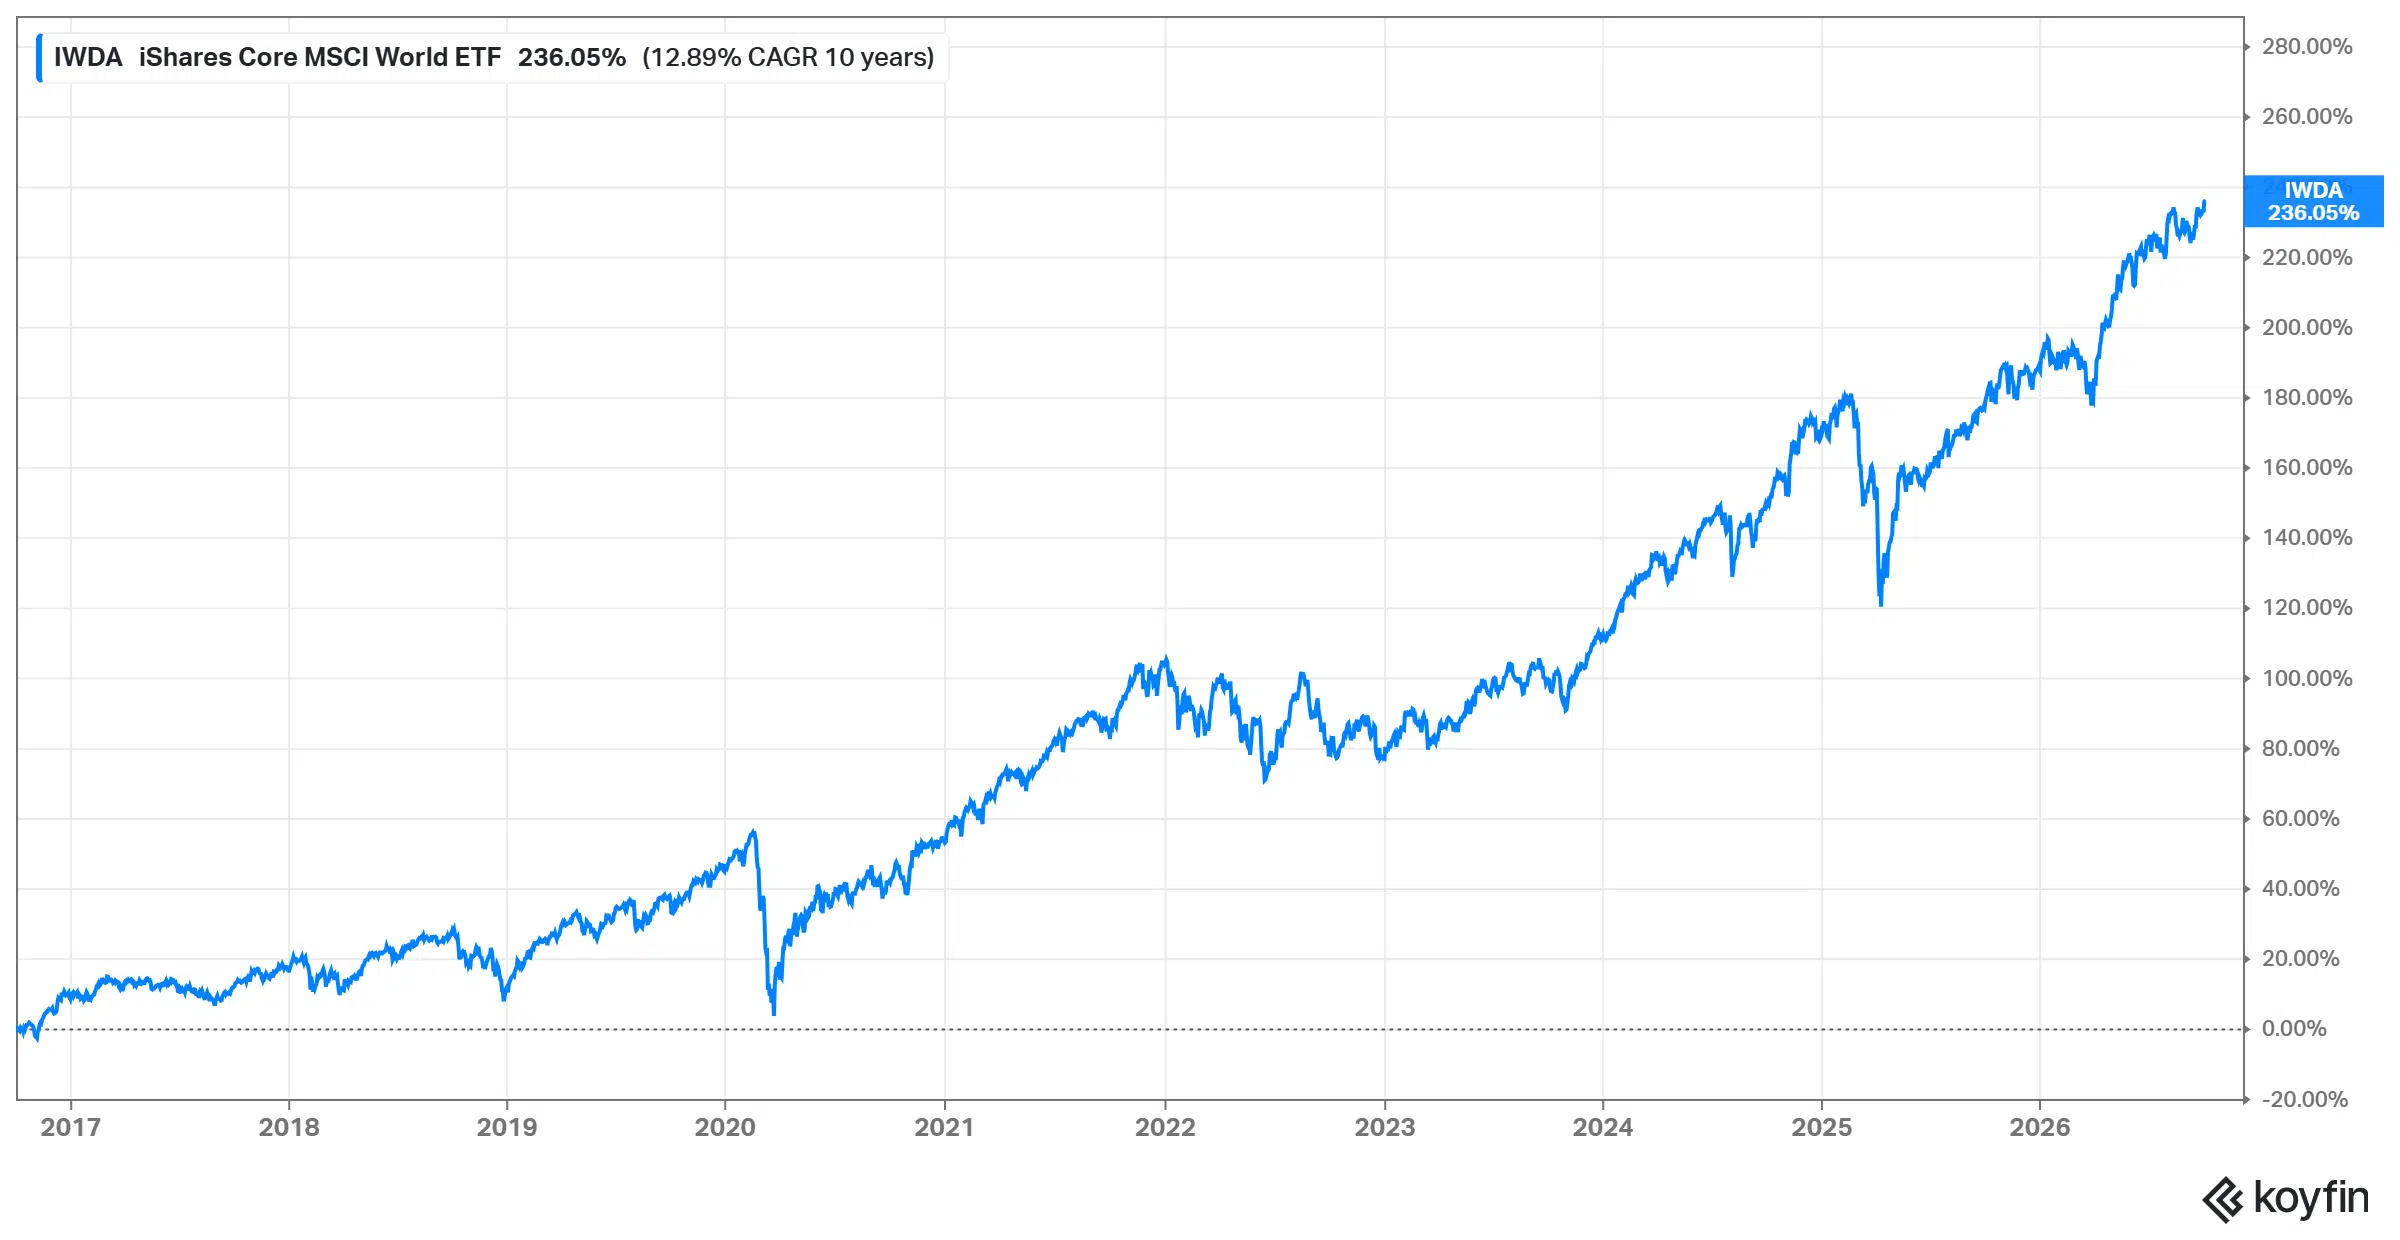
Over the 10 years to early October 2026, it returned +236.05% in euros, or 12.89% a year:
We now move on to the comparative study between VWCE and IWDA, in which we will take into account different aspects, namely:
| Performance: | Since VWCE’s launch in July 2019, IWDA has returned more (+148.8% vs +139.2% in euros). Over the last year, VWCE has done better, helped by emerging markets. |
| TER: | VWCE has the lower TER (0.14% vs 0.20%), which makes it the cheaper fund. |
| Portfolio structure: | The style of the stocks is similar. However, VWCE has more exposure to Asia and emerging markets, while IWDA is more concentrated in the US. |
IMPORTANT: Before starting the comparison, note that we are discussing two ETFs whose benchmarks differ. That is why we cannot name a winner and a loser: that would require both funds to track the same benchmark.
Geographic distribution
VWCE
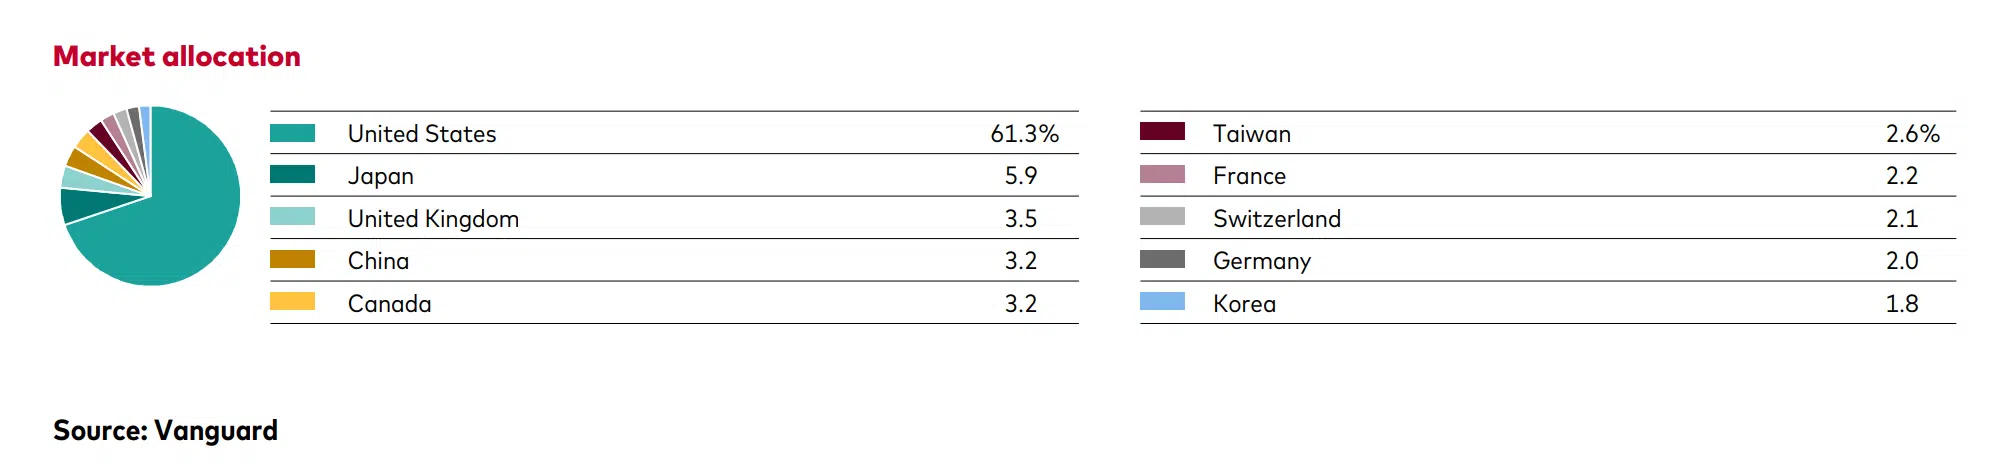
For VWCE, the geographic allocation is led by the United States, with 61.7% of the portfolio at the end of August 2026. Japan follows with 6.0%, then Taiwan and the United Kingdom (3.3% each), Canada (3.0%), China (2.7%) and South Korea (2.5%).
Below is VWCE’s top 10 geographic breakdown by percentage (factsheet):
IWDA
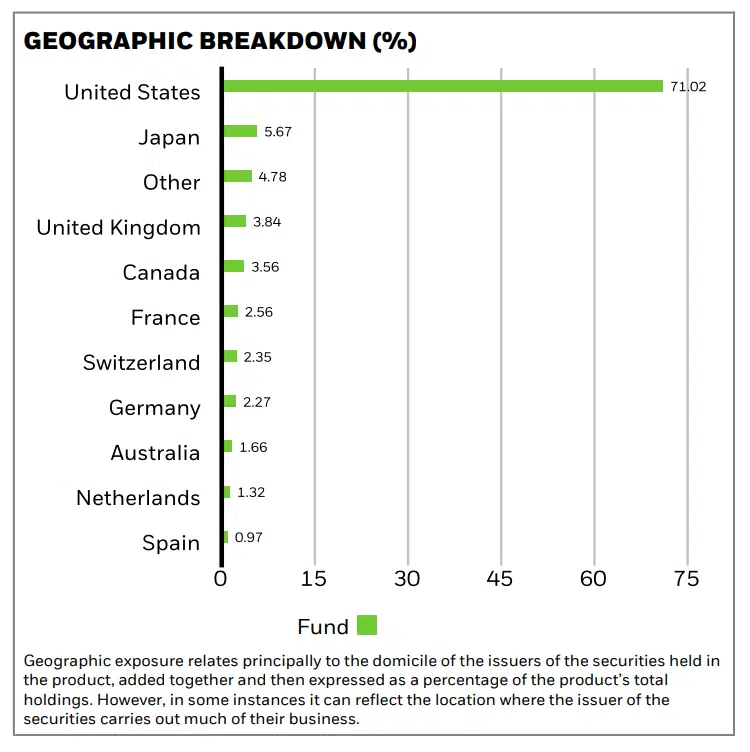
For IWDA, 71.8% of the portfolio is allocated to the United States, with Japan second at 5.8%. Other notable allocations include the United Kingdom (3.5%), Canada (3.4%), France (2.4%) and Switzerland (2.2%). Taiwan, China and South Korea, which together weigh 8.5% in VWCE, are not included at all.
Below is IWDA’s top 10 geographic breakdown by percentage (factsheet):
Sector diversification
Both VWCE and IWDA are broadly diversified across similar sectors, with technology leading the way in both portfolios. Other key sectors such as Financials, Consumer Discretionary, and Industrials hold comparable weightings between the two funds.
Below is a breakdown of the sector allocations for VWCE and IWDA. Note that Vanguard uses the ICB classification and iShares the GICS classification, so some companies fall in different sectors (for example, Alphabet and Meta count as technology in ICB but as communication services in GICS):
| Sector | VWCE | IWDA |
| Technology | 34.1% | 29.5% |
| Financials | 15.5% | 16.5% |
| Industrials | 12.3% | 11.2% |
| Consumer Discretionary | 11.0% | 8.8% |
| Health Care | 8.0% | 9.2% |
| Communication Services | 3.3% | 8.0% |
| Consumer Staples | 3.9% | 4.9% |
| Energy | 4.2% | 4.0% |
| Basic Materials | 3.4% | 3.5% |
| Utilities | 2.5% | 2.4% |
| Real Estate and other | 1.7% | 2.1% |
Sector weights as of 31 August 2026. VWCE uses ICB sectors (Telecommunications shown as Communication Services) and IWDA uses GICS sectors. Sources: Vanguard and iShares factsheets.
Portfolio structure
When comparing the number of holdings, VWCE offers broader exposure with 3,784 stocks, covering both developed and emerging markets. On the other hand, IWDA holds 1,279 stocks, focusing solely on developed markets.
While it may seem odd that VWCE holds more stocks despite being a younger fund, the reason lies in its inclusion of emerging markets, which adds a greater number of constituents to its portfolio compared to IWDA’s developed market focus.
Top 10 holdings
| VWCE | IWDA | ||
| Stocks | Weights | Stocks | Weights |
| NVIDIA Corp. | 4.8% | NVIDIA | 5.43% |
| Apple Inc. | 4.3% | Apple | 5.08% |
| Microsoft Corp. | 3.5% | Microsoft | 3.92% |
| Alphabet Inc. | 3.3% | Amazon.com Inc | 2.79% |
| Amazon.com Inc. | 2.3% | Alphabet Class A | 2.18% |
| Taiwan Semiconductor Manufacturing Co. Ltd. | 1.7% | Broadcom Inc | 1.79% |
| Broadcom Inc. | 1.6% | Alphabet Class C | 1.71% |
| Meta Platforms Inc. | 1.2% | Meta Platforms Class A | 1.37% |
| Micron Technology Inc. | 1.0% | Micron Technology | 1.14% |
| Tesla Inc. | 1.0% | Tesla Inc | 1.06% |
| Top 10 total | 24.8% | Top 10 total | 26.47% |
Top 10 holdings as of 31 August 2026. VWCE shows Alphabet’s two share classes combined. Sources: Vanguard and iShares factsheets.
Performance
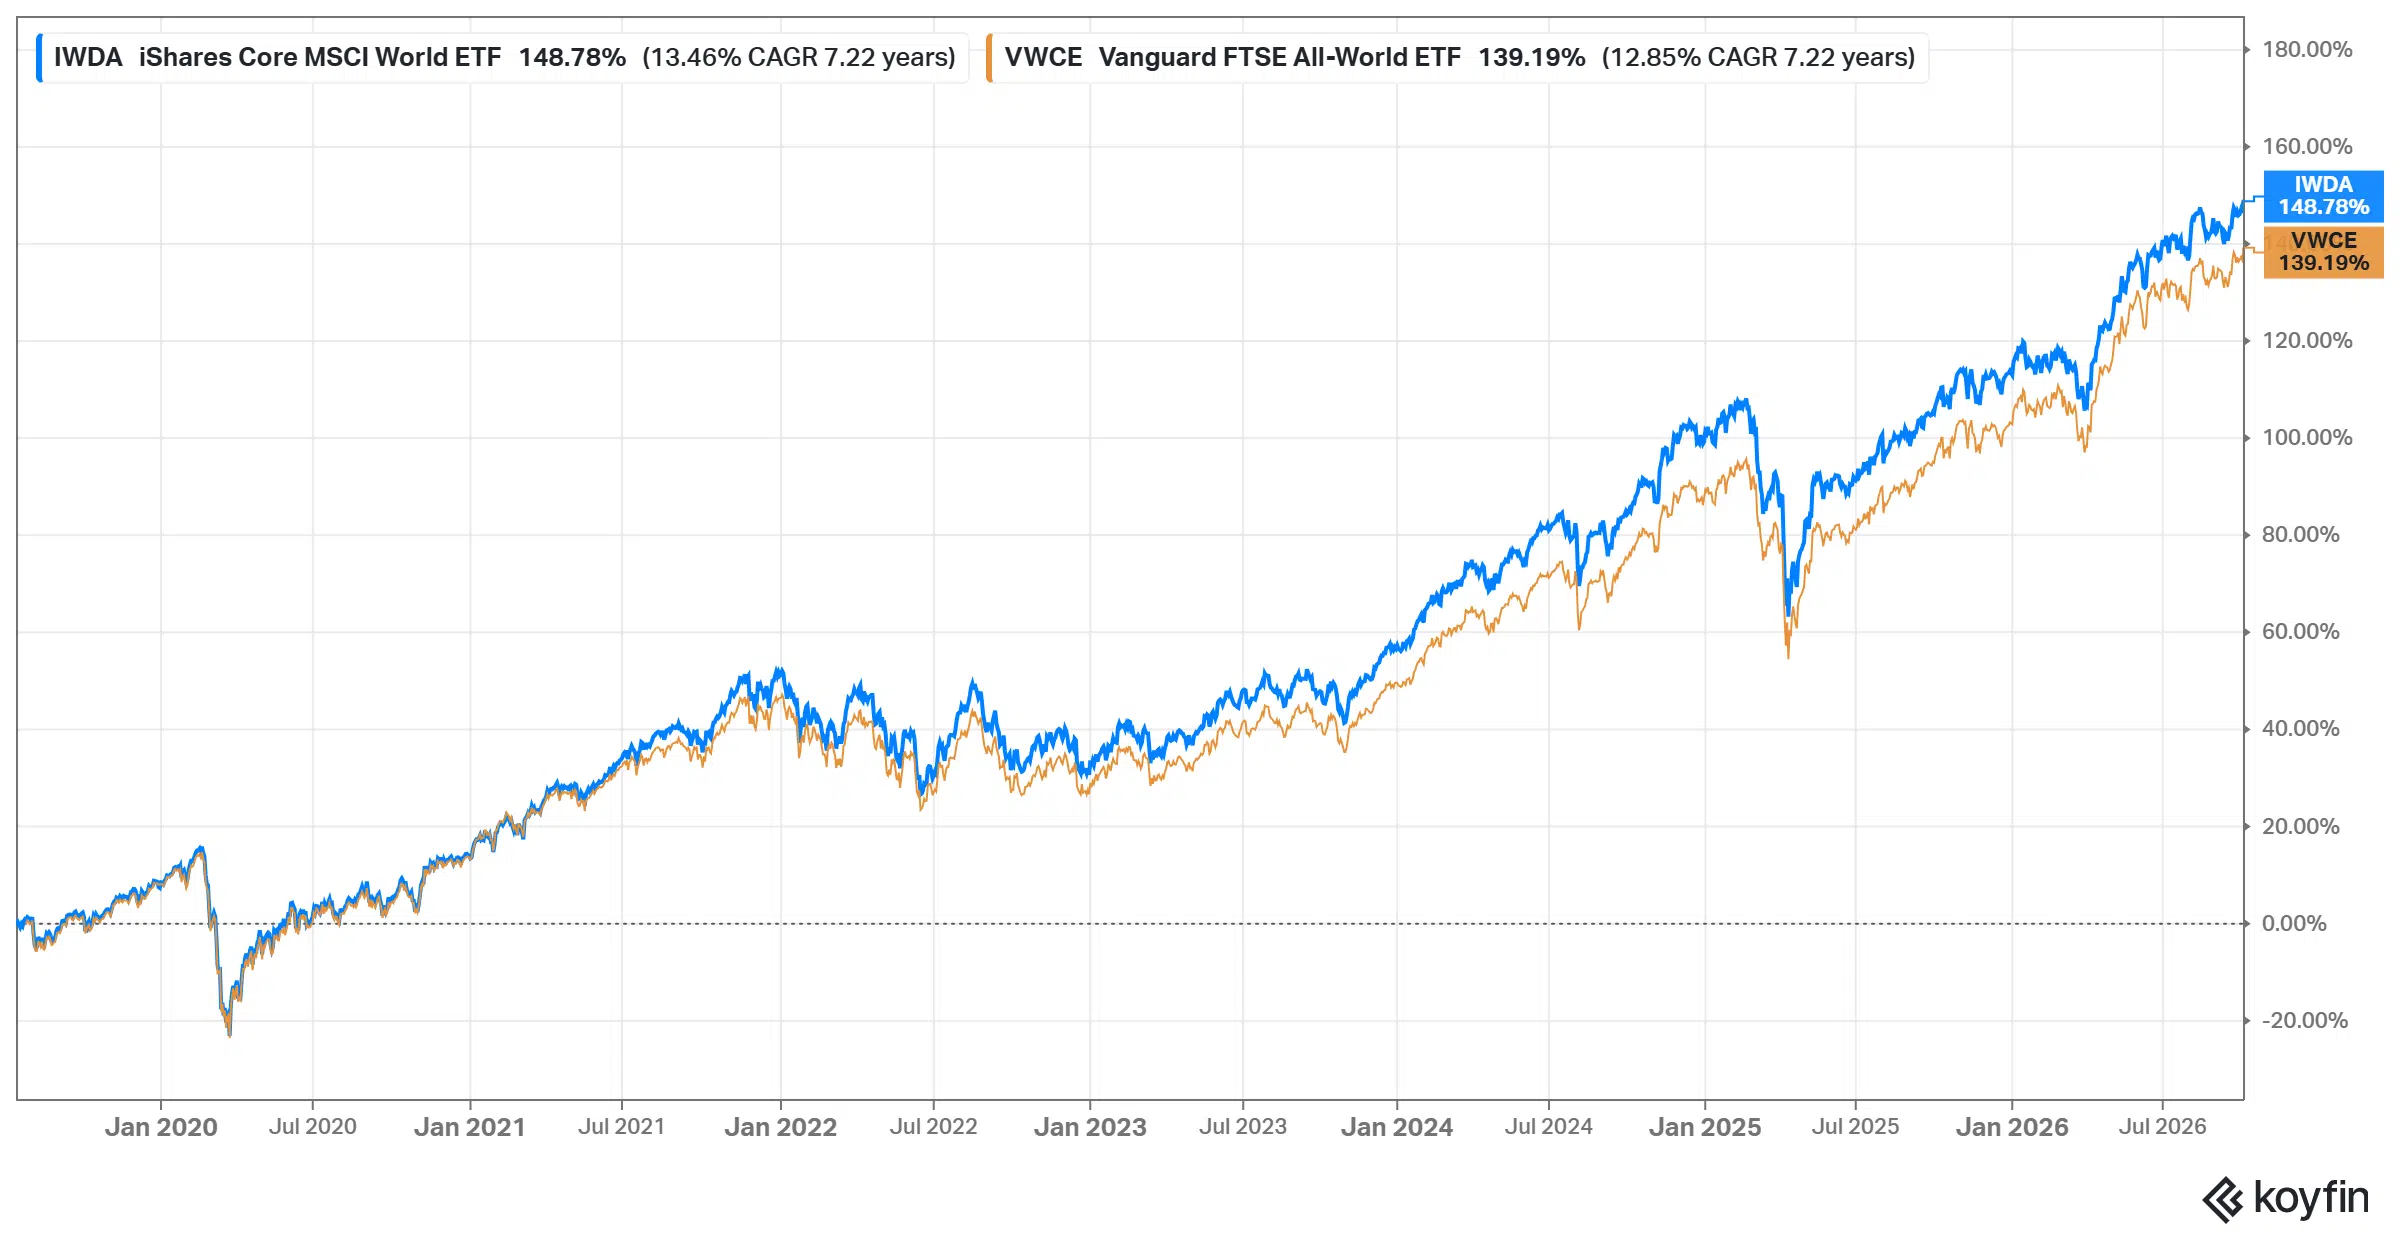
We will start with the comparative performance of the two ETFs. As the VWCE is younger than the IWDA, we will take the reference in the date of the former.
In the chart, we can see that the performance of IWDA (in blue) surpasses that of VWCE (in orange). Over the same period (from July 2019 to early October 2026), IWDA returned +148.8% in euros (13.46% a year), while VWCE returned +139.2% (12.85% a year).
The gap is not one-way. Over the 12 months to 31 August 2026, VWCE beat IWDA, as emerging markets such as Taiwan, South Korea and China rallied, and over 3 years the two were almost level:
| Period (annualised, USD) | VWCE | IWDA |
| 1 year | 22.29% | 20.39% |
| 3 years | 20.45% | 20.14% |
| 5 years | 10.90% | 11.27% |
| Since inception | 13.27% (2019) | 11.17% (2009) |
Annualised NAV returns in USD as of 31 August 2026. Sources: Vanguard and iShares factsheets.
Past performance does not guarantee future results, and these returns may not be sustained over time.
TER (Total Expense Ratio)
The TER is the indicator that refers to all the fees incurred by an ETF, so the lower rate is better.
The TER in the case of the IWDA is 0.20% p.a., while in the case of the VWCE, it is 0.14% p.a. VWCE is therefore cheaper: on a €10,000 investment, it costs about €14 a year against €20 for IWDA. That is notable, because the nature of each ETF would normally point the other way.
Thus, the IWDA invests in securities of developed countries, where costs are efficient, and currency dispersion is little. On the other hand, the VWCE ETF invests in developed and developing countries, where rates are not standardized and many more currencies are involved, which would typically imply higher fees.
If you want developed markets plus emerging markets but prefer iShares, a common alternative is to combine IWDA with an emerging markets ETF such as EIMI, but that means two funds to manage and rebalance.
Risk factors
While the VWCE and IWDA strategies offer a diversified way to invest, it’s important to understand the associated risks that could affect your investment.
-
Market risk and global exposure
Both VWCE and IWDA invest solely in equities, meaning they are subject to market volatility. If global stock markets decline, your investment will also experience losses. To mitigate this risk, you might consider diversifying into other asset classes, such as bonds or real estate.
-
Currency risk
Although both VWCE and IWDA are quoted in EUR on European exchanges, their underlying assets are mostly denominated in USD. As a result, fluctuations in the USD/EUR exchange rate can affect your returns. A weakening U.S. dollar can reduce your gains when converting back to EUR, even if the funds perform well.
-
Concentration risk
Both funds are dominated by large US technology companies: the top 10 holdings make up about a quarter of each portfolio, and the US weighs 62% in VWCE and 72% in IWDA.
-
Inflexibility in asset allocation
With VWCE and IWDA, you are tied to their respective indices. If you prefer greater control over specific regions or sectors, these ETFs may limit your flexibility in portfolio management.
Cheapest brokers to invest in VWCE and IWDA
Now that you know the key differences between VWCE and IWDA, it’s time to choose a broker. We’ve highlighted 5 European ETF brokers below, each offering different benefits for different types of investors.
| Broker | ETF fees | Minimum deposit | Number of ETFs |
| eToro | $0 (other fees apply) | $50 (varies between countries) | 300+ |
| Interactive Brokers | Varies by exchange. In Europe, 0.05% of trade value (min. €1.25, max. €29) | €/$/£0 | 13,000+ |
| DEGIRO | €0 + €1 handling fee on Core Selection ETFs, otherwise €2 + €1. Connectivity fee of up to €2.50 a year per foreign exchange | €0 | 1,000+ in the Core Selection |
| XTB | 0% up to €100,000 of monthly turnover (other fees apply) | €0 | 100+ |
| Lightyear | No Lightyear execution fees for ETFs (other fees may apply) | €/$/£1 | 150+ |
Disclaimer: Investing involves risk of loss.
CFDs are complex instruments and come with a high risk of losing money rapidly due to leverage. 52% of retail investor accounts lose money when trading CFDs with this provider. You should consider whether you understand how CFDs work and whether you can afford to take the high risk of losing your money.Disclaimer: Capital at risk. The provider of investment services is Lightyear Financial Ltd for the UK and Lightyear Europe AS for the EU. Terms apply: lightyear.com/terms. Seek qualified advice if necessary.
Bottom line
In conclusion, both VWCE and IWDA are solid options for global equity exposure. VWCE includes both developed and emerging markets, offering broader diversification. IWDA, by contrast, focuses solely on developed markets and has delivered higher returns since 2019, although VWCE did better over the last year and is cheaper (0.14% vs 0.20%).
So, VWCE vs IWDA: which ETF is better for you?
If you want a single fund with exposure to emerging markets and a lower TER, VWCE might be a suitable option. If you prefer to stick to developed markets, or want to add emerging markets separately, IWDA could be a better fit. Ultimately, the decision should align with your financial goals.
If you require additional guidance or have further questions, please don’t hesitate to contact us.
FAQs
Is VWCE or IWDA better for long-term investors?
Both are solid core holdings. VWCE gives you the whole world, including emerging markets, in one fund at 0.14% a year. IWDA covers only developed markets at 0.20% a year. Since 2019, IWDA has returned slightly more because the US outperformed, but that can change, as the last year showed.
Does IWDA include emerging markets?
No. IWDA tracks the MSCI World Index, which covers 23 developed countries. Countries such as China, Taiwan, India and South Korea are not included. To add them, you would need a separate emerging markets ETF.
Do VWCE and IWDA pay dividends?
No. Both are accumulating ETFs, so dividends received from the underlying companies are reinvested in the fund. Vanguard and iShares also offer distributing versions (VWRL and IWRD, for example) if you prefer regular payouts.
Can I hold both VWCE and IWDA?
You can, but there is a large overlap: almost all of IWDA’s holdings are also in VWCE. Holding both mainly increases your weight in developed markets, so it rarely makes sense unless you want that tilt.